GLOBAL RESEARCH SYNDICATE
No Result
View All Result
  • Login
  • Latest News
  • Consumer Research
  • Survey Research
  • Marketing Research
  • Industry Research
  • Data Collection
  • More
    • Data Analysis
    • Market Insights
  • Latest News
  • Consumer Research
  • Survey Research
  • Marketing Research
  • Industry Research
  • Data Collection
  • More
    • Data Analysis
    • Market Insights
No Result
View All Result
globalresearchsyndicate
No Result
View All Result
Home Data Analysis

An explanation of machine learning models even you could understand

globalresearchsyndicate by globalresearchsyndicate
May 14, 2020
in Data Analysis
0
An explanation of machine learning models even you could understand
0
SHARES
4
VIEWS
Share on FacebookShare on Twitter

Supervised machine learning models

Logistic Regression

Logistic regression is used when you have a classification problem. This means that your target variable (a.k.a. the variable you are interested in predicting) is made up of categories. These categories could be yes/no, or something like a number between 1 and 10 representing customer satisfaction.

The logistic regression model uses an equation to create a curve with your data and then uses this curve to predict the outcome of a new observation.

Illustration of Logistic Regression

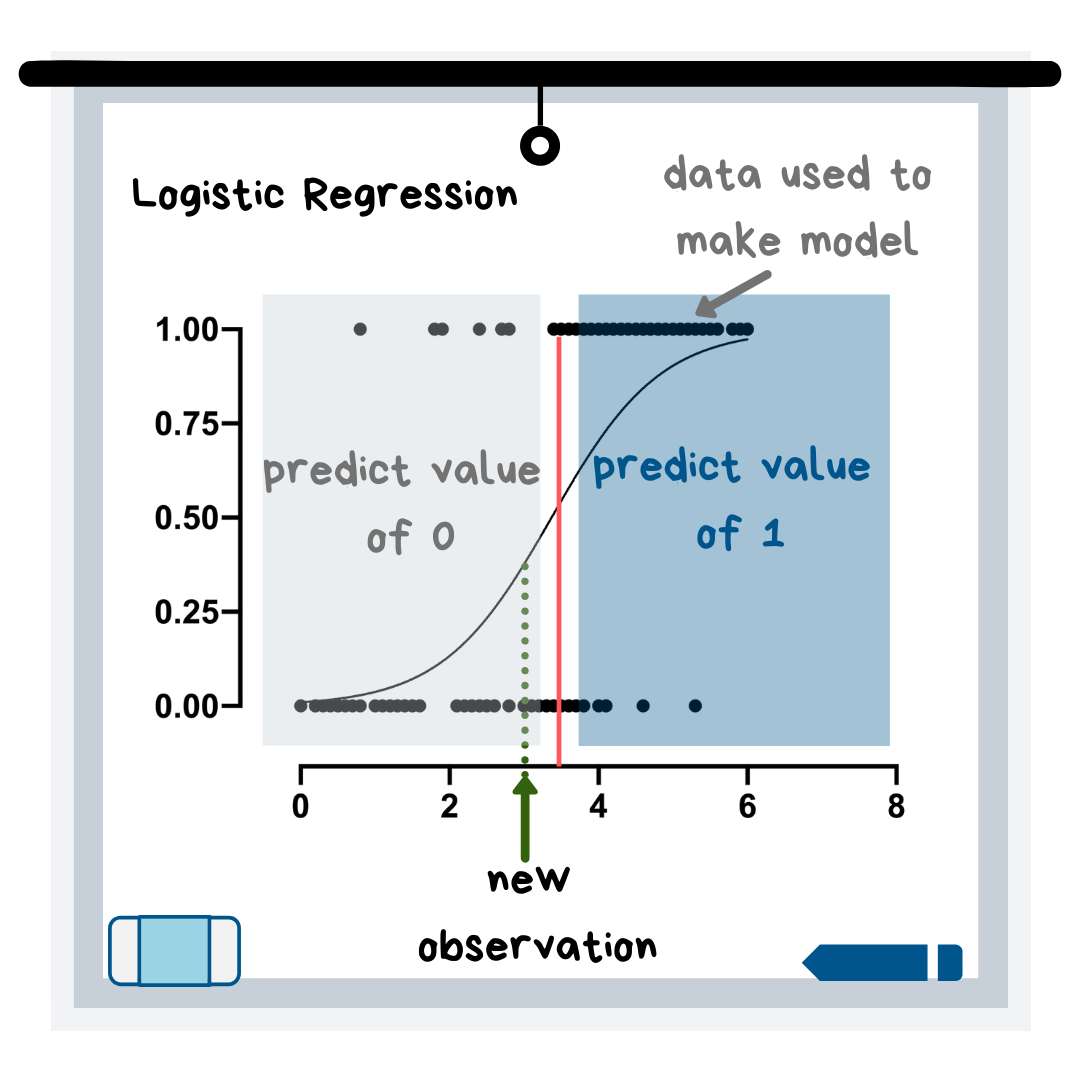
In the graphic above, the new observation would get a prediction of 0 because it falls on the left side of the curve. If you look at the data this curve is based on, it makes sense because, in the “predict a value of 0” region of the graph, the majority of the data points have a y-value of 0.

Linear Regression

Linear regression is often one of the first machine learning models that people learn. This is because its algorithm (i.e. the equation behind the scenes) is relatively easy to understand when using just one x-variable — it is just making a best-fit line, a concept taught in elementary school. This best-fit line is then used to make predictions about new data points (see illustration).

Illustration of Linear Regression

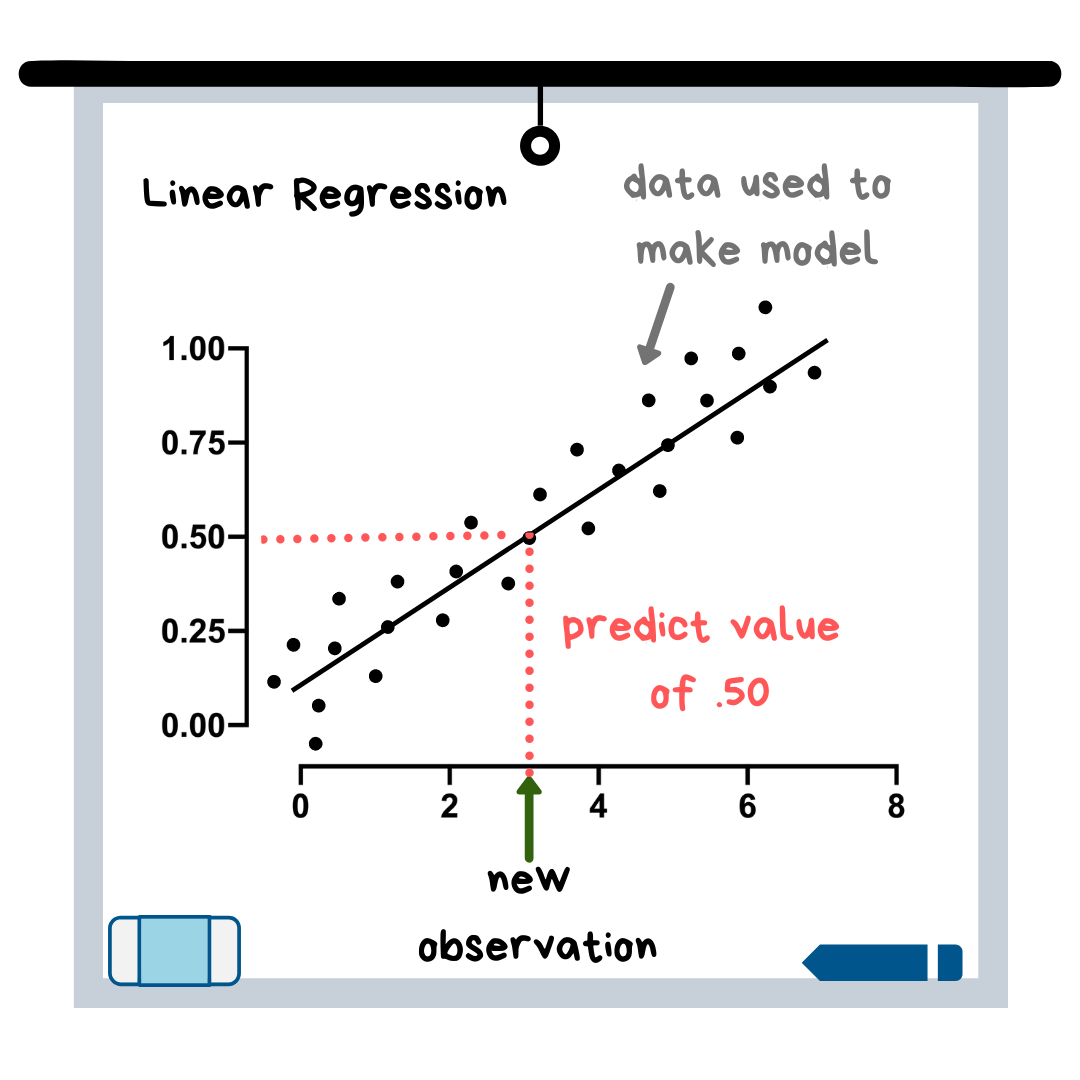
Linear Regression is similar to logistic regression, but it is used when your target variable is continuous, which means it can take on essentially any numerical value. In fact, any model with a continuous target variable can be categorized as “regression.” An example of a continuous variable would be the selling price of a house.

Linear regression is also very interpretable. The model equation contains coefficients for each variable, and these coefficients indicate how much the target variable changes for each small change in the independent variable (the x-variable). With the house prices example, this means that you could look at your regression equation and say something like “oh, this tells me that for every increase in 1ft² of house size (the x-variable), the selling price (the target variable) increases by $25.”

K Nearest Neighbors (KNN)

This model can be used for either classification or regression! The name “K Nearest Neighbors” is not intended to be confusing. The model first plots out all of the data. The “K” part of the title refers to the number of closest neighboring data points that the model looks at to determine what the prediction value should be (see illustration below). You, as the future data scientist, get to choose K and you can play around with the values to see which one gives the best predictions.

Illustration of K Nearest Neighbors

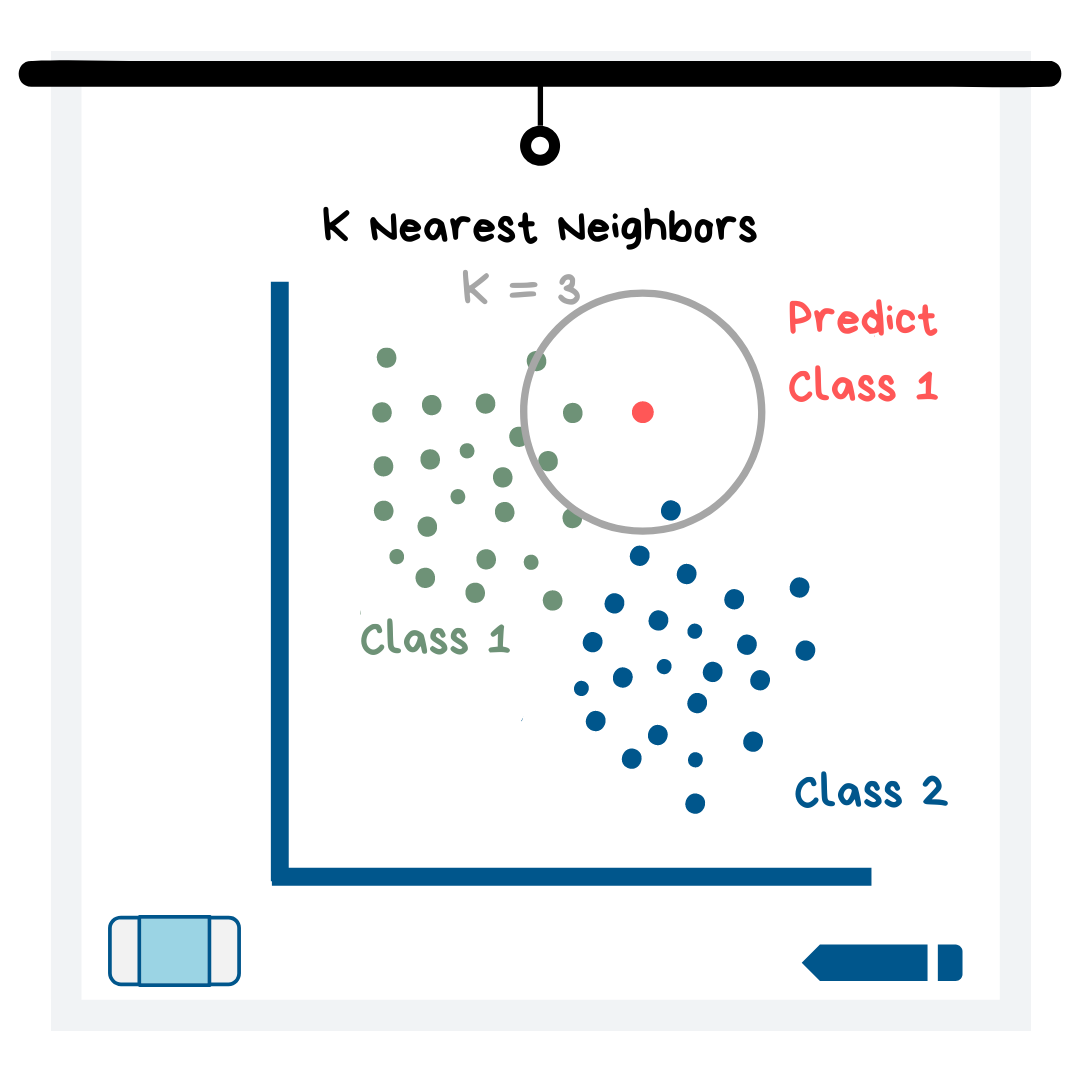
All of the data points that are in the K=__ circle get a “vote” on what the target variable value should be for this new data point. Whichever value receives the most votes is the value that KNN predicts for the new data point. In the illustration above, 2 of the nearest neighbors are class 1, while 1 of the neighbors is class 2. Thus, the model would predict class 1 for this data point. If the model is trying to predict a numerical value instead of a category, then all of the “votes” are numerical values that are averaged to get a prediction.

Support Vector Machines (SVMs)

Support Vector Machines work by establishing a boundary between data points, where the majority of one class falls on one side of the boundary (a.k.a. line in the 2D case) and the majority of the other class falls on the other side.

Illustration of Support Vector Machines

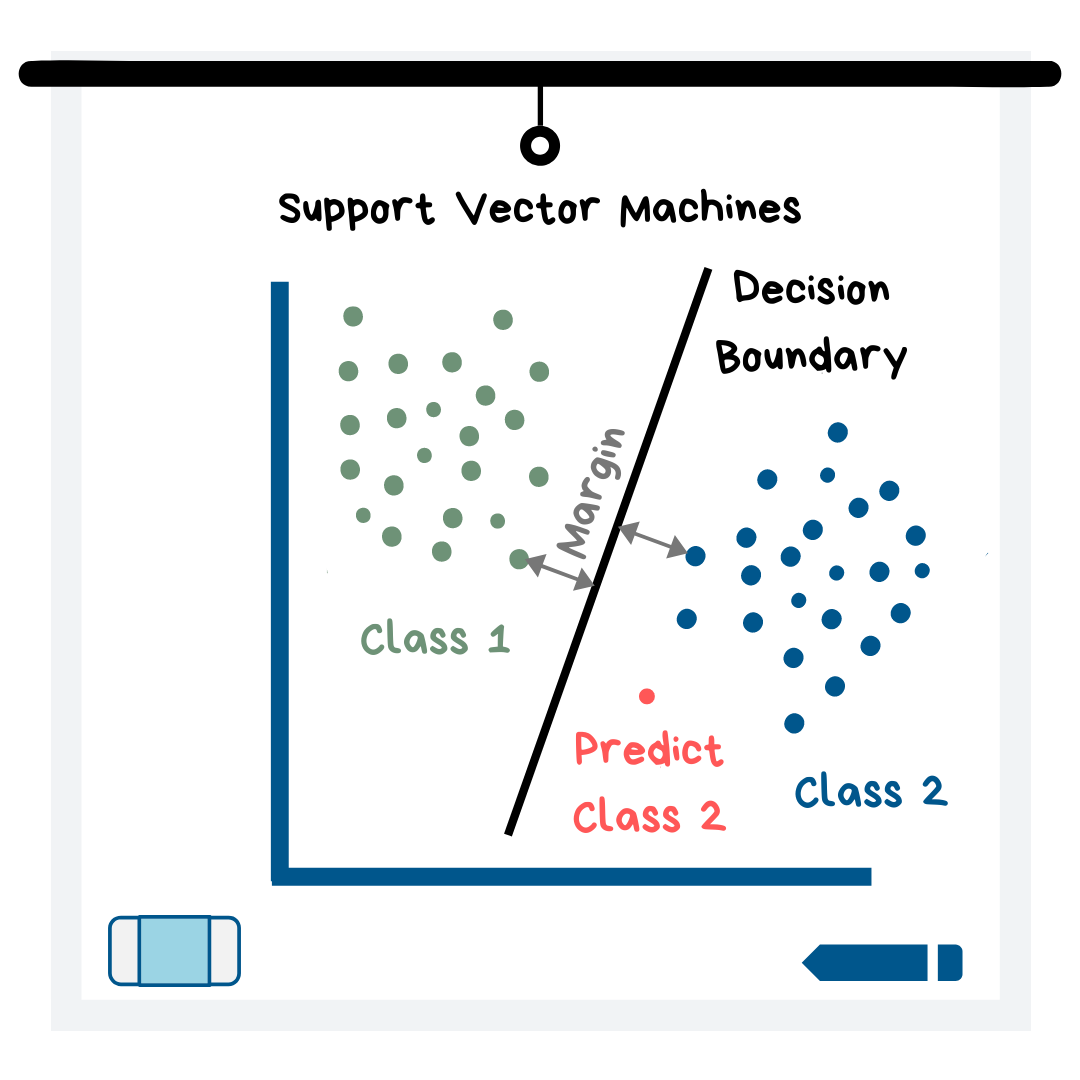
The way it works is the machine seeks to find the boundary with the largest margin. The margin is defined as the distance between the nearest point of each class and the boundary (see illustration). New data points are then plotted and put into a class depending on which side of the boundary they fall on.

My explanation of this model is for the classification case, but you can also use SVMs for regression!

Decision trees & random forests

I already explained these in a previous article — check it out here (decision trees and random forests are near the end).

Unsupervised machine learning models

Related Posts

How Machine Learning has impacted Consumer Behaviour and Analysis
Consumer Research

How Machine Learning has impacted Consumer Behaviour and Analysis

January 4, 2024
Market Research The Ultimate Weapon for Business Success
Consumer Research

Market Research: The Ultimate Weapon for Business Success

June 22, 2023
Unveiling the Hidden Power of Market Research A Game Changer
Consumer Research

Unveiling the Hidden Power of Market Research: A Game Changer

June 2, 2023
7 Secrets of Market Research Gurus That Will Blow Your Mind
Consumer Research

7 Secrets of Market Research Gurus That Will Blow Your Mind

May 8, 2023
The Shocking Truth About Market Research Revealed!
Consumer Research

The Shocking Truth About Market Research: Revealed!

April 25, 2023
market research, primary research, secondary research, market research trends, market research news,
Consumer Research

Quantitative vs. Qualitative Research. How to choose the Right Research Method for Your Business Needs

March 14, 2023
Next Post
NRL referees dispute set to turn ugly | The Islander

NRL referees dispute set to turn ugly | The Islander

Categories

  • Consumer Research
  • Data Analysis
  • Data Collection
  • Industry Research
  • Latest News
  • Market Insights
  • Marketing Research
  • Survey Research
  • Uncategorized

Recent Posts

  • Ipsos Revolutionizes the Global Market Research Landscape
  • How Machine Learning has impacted Consumer Behaviour and Analysis
  • Market Research: The Ultimate Weapon for Business Success
  • Privacy Policy
  • Terms of Use
  • Antispam
  • DMCA

Copyright © 2024 Globalresearchsyndicate.com

Welcome Back!

Login to your account below

Forgotten Password?

Retrieve your password

Please enter your username or email address to reset your password.

Log In
This website uses cookies to improve your experience. We'll assume you're ok with this, but you can opt-out if you wish. Cookie settingsACCEPT
Privacy & Cookies Policy

Privacy Overview

This website uses cookies to improve your experience while you navigate through the website. Out of these cookies, the cookies that are categorized as necessary are stored on your browser as they are essential for the working of basic functionalities of the website. We also use third-party cookies that help us analyze and understand how you use this website. These cookies will be stored in your browser only with your consent. You also have the option to opt-out of these cookies. But opting out of some of these cookies may have an effect on your browsing experience.
Necessary
Always Enabled
Necessary cookies are absolutely essential for the website to function properly. This category only includes cookies that ensures basic functionalities and security features of the website. These cookies do not store any personal information.
Non-necessary
Any cookies that may not be particularly necessary for the website to function and is used specifically to collect user personal data via analytics, ads, other embedded contents are termed as non-necessary cookies. It is mandatory to procure user consent prior to running these cookies on your website.
SAVE & ACCEPT
No Result
View All Result
  • Latest News
  • Consumer Research
  • Survey Research
  • Marketing Research
  • Industry Research
  • Data Collection
  • More
    • Data Analysis
    • Market Insights

Copyright © 2024 Globalresearchsyndicate.com