
- GBP/USD remained depressed for the second consecutive session on Friday.
- Break below the 23.6% Fibo. might have paved the way for further weakness.
- Mixed technical indicators warrant caution before placing fresh bearish bets.
The GBP/USD pair witnessed some follow-through selling for the second consecutive session on Friday and retreated further from 34-month tops set earlier this week. The pullback extended through the first half of the European session and dragged the pair to fresh three-day lows, around the 1.3775 region in the last hour.
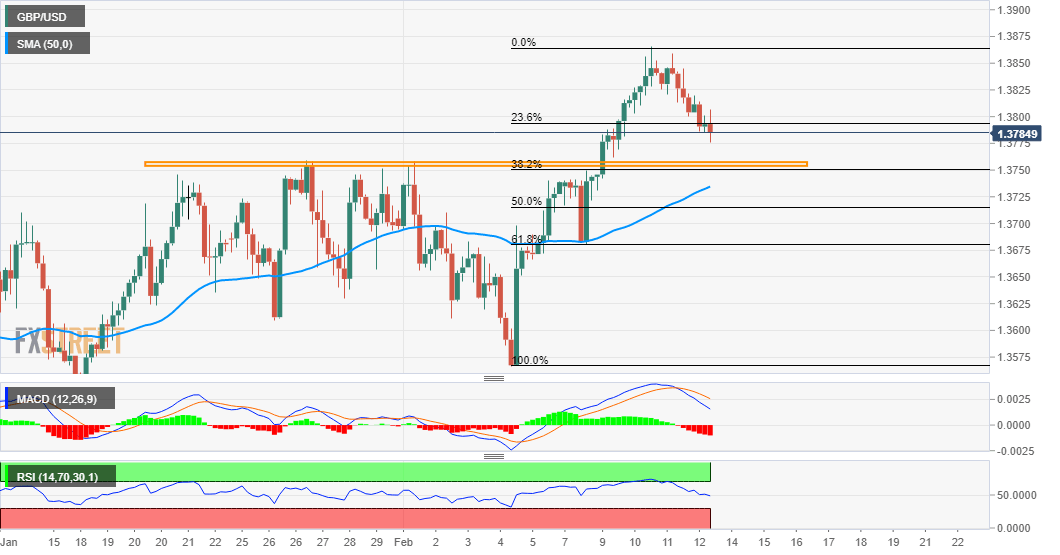
With the latest leg down, the GBP/USD pair has now slipped below the 23.6% Fibonacci level of the post-BoE strong move up and seems vulnerable to extend the corrective slide. Moreover, technical indicators on hourly charts have been drifting into the negative territory and add credence to the intraday bearish outlook.
That said, oscillators on the daily chart – though have been losing positive traction – are yet to confirm the bearish bias. Hence, any subsequent fall is likely to find decent support near the 1.3760-55 resistance breakpoint, which should act as a key pivotal point and help determine the GBP/USD pair’s near-term trajectory.
This makes it prudent to wait for some strong follow-through selling below the mentioned support before confirming that the GBP/USD pair has topped out in the near-term. A convincing breakthrough will set the stage for a further depreciating move and drag the pair further towards 50% Fibo. level, around the 1.3715-10 region.
On the flip side, immediate resistance is pegged near the 1.3830 level ahead of mid-1.3800s. Sustained move beyond the latter will be seen as a fresh trigger for bullish traders and push the pair towards the 1.3900 mark en-route the 1.3940-50 hurdle. The momentum could further get extended towards the key 1.4000 psychological mark.
GBP/USD 4-hourly chart
Technical levels to watch


