
- GBP/NOK’s bulls have resurfaced in a large daily spike.
- There is strong support from a long term perspective that gives rise to bullish prospects.
GBP/NOK has finally broken structure to the upside and printed a fresh high from where a correction would be expected.
This gives rise to a swing trading opportunity derived from the following top-down analysis.
Monthly chart
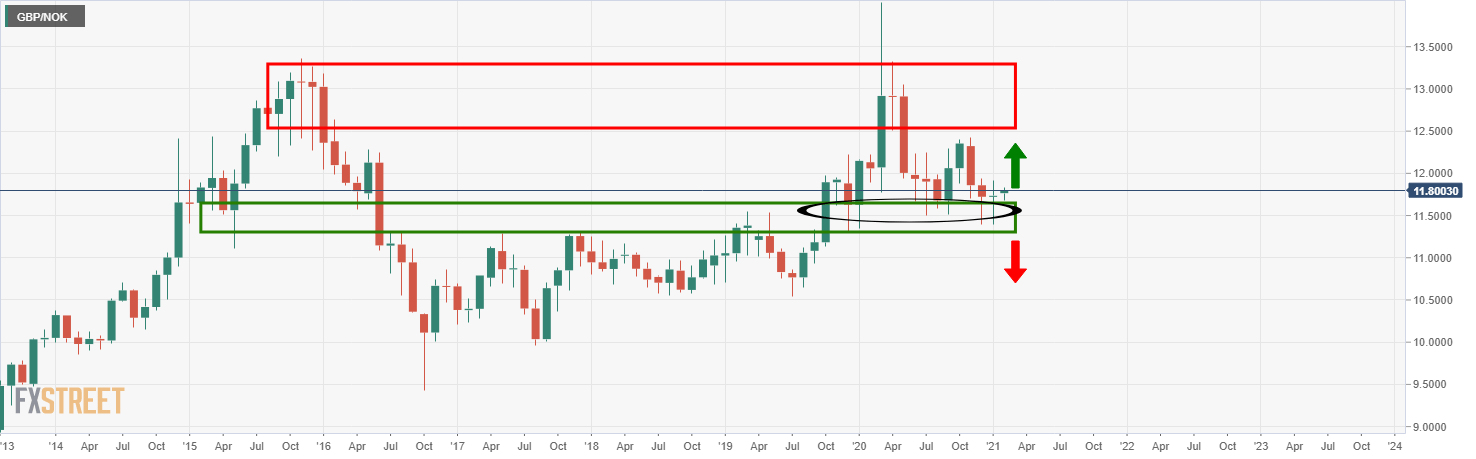
From the monthly perspective, there is very strong support from which the price would be expected to rise from, again.
Weekly chart
-637480792691289464.png)
The weekly chart offers a conflicting scenario given that the wick is supposed to be filled on a lower time frame, yet resistance is apparent from prior price action.
Nevertheless, considering the wick has already penetrated the resistance zone, liquidity may already be drying up in this area which would enable the price to glide on through from a daily perspective.
Daily chart
-637480798285167633.png)
The price rallied on Thursday which has cleared grounds for an opportunity on the 4-hour chart below.
4-hour chart
-637480805918358241.png)
The 4-hour chart offers a 1:3 risk to reward set up with a stop placed deep below the structure, expected to hold, and a target beyond the recent highs.
The buy limit is not far off from the current spot price.


