There are challenges, however, in maintaining analytical robustness of TDLAS methods for onsite application. The major common obstacles are spectral fringe (caused by the etalon effect of multiple re- flections from optical surfaces) and spectral interference (caused by background gas and spectra deformation due to system degradation). When these factors are combined in a complicated process analysis, they can cause a TDLAS analyzer to deviate from the original calibration.
Strategies to reduce the effects of spectral baseline structures include anti-reflection coatings, wedging or tilting the optical surfaces, dithering one surface and integrating the signal to average out its influence, and selecting a modulation frequency (5). Li introduced a discrete wavelet transform (DWT) method with optimized wavelet pairs to analyze spectra with different noise levels and baseline drift (6). Chemometric methods, such as the classical least squares (CLS) fitting method (7) and the partial least square (PLS) fitting method (8), have been commonly adopted in TDLAS to suppress spectral interferences.
When spectral interference or deformation becomes strong, it is hard to achieve satisfactory performance with linear regression algorithms. This changed with the introduction of machine learning algorithms such as artificial neural networks (ANN) (7), and support vector machines (SVM) (8) and extreme learning machine (ELM) models (9,10). ELM, a novel single-layer forward neuronetworking (SLFN) algorithm developed by Huang (11,12), aims to reach not only the smallest training error, but also the smallest norm of output weights. In addition, ELM offers better training speed and generalization ability than backprop (BP) neuronetworking and SVM (13).
ELM is capable of regression and classification (12,14), and has been used in micro-NIR, Fourier-transform infrared (FT-IR), and laser-induced breakdown spectroscopy (LIBS) (9,10). Application in TDLAS has not been carried out so far. Therefore, we introduce the ELM algorithm in a TDLAS process analyzer to improve its performance.
Theory and Algorithm
Extreme Learning Machine Model
The ELM model output O is expressed as:
where βi is the output weight, Wi = [w1, w2, … , win]T is input weight, Xj is the j-th sample spectra in X, g(…) is the activation function, Wi ∙ Xj is the inner product, bi is the bias, oj is the output with respect to Xj, N is the number of the sample, L is the number of hidden layer nodes, n is the input layer neuron number, and the output layer neuron number is 1.
The goal of ELM model training is to obtain the estimated βi by minimizing the difference between real value t and model prediction o,
β = H-1T=H+ (HHT)-1T [2]
where T is matrix form of t, and
Optimization and Genetic Algorithm (GA)
The first step in spectral analysis is preprocessing, which involves multi-scan averaging, Savitzky–Golay smoothing, and optical power normalization.
An ELM model can be optimized through several factors. The activation function is critical in terms of model convergence speed and predication accuracy (12). Recent research showed that the stability and accuracy of an ELM model were further improved by optimization of L, W, and b (15–16).
GA is useful for searching for the global optimized parameter and avoiding local optima, through many generations of selection, crossover, and mutation operation. GA is also ideal for W and b optimization.
Performance Evaluation
The purpose of ELM application is to enhance the robustness of the spectroscopic analyzer in process analysis. The accuracy of key measurements is expected to improve after spectra restoration with ELM.
As the basis, CLS is introduced to derive the concentration from spectra:
where Y is the input spectra, Ri is the reference spectrum, and ai (i = 1…n) is the regression coefficient which is used to derive the gas concentration. Relative error (RE) is used as model performance indicator:
where oi and ti are the prediction and real values of the i-th spectrum, and Fs is the full range. In contrast to 3σ criterion, the RE is more stringent.
Experiment
Trace ethylene (C2H4) measurement in petrochemical process analysis was chosen as an example. There were strong spectral interferences from coexisting background components. The spectral region from 1626.25 nm to 1626.70 nm was chosen for C2H4 analysis, where peak absorbance of CH4, C2H6, and CO2 were much weaker than C2H4.
The analyzer’s micro controller (MCU) controls a laser module PCI-FPGA-1A(Port City Instruments) to drive the laser with scan and modulation functions. The tuning range of the distributed feedback (DFB) laser is around 0.45 nm, which covers two C2H4 absorption peaks at 1626.35 and 1626.53 nm. The laser temperature is stabilized by a TEC module WTC3293. The cascade integrator comb filter–based demodulation output DC and 2f (17), together with gas temperature T and pressure P, are collected by an ADC.
The process of TDLAS analyzer gas concentration measurement is shown in Figure 1. The spectra generation process is illustrated in Figure 1a. The procedure of calibration model training and verification is illustrated in Figures 1b and 1c, where the impact on accuracy by laser frequency drift and spectral interference are demonstrated.
We will address two spectral analysis issues. The first is the gas concentration prediction accuracy caused by background and gas pressure variation during process measurement. The second is the inaccurate spectral shift calculation in the presence of strong spectral interference. With ELM, we aimed to accurately calculate both gas concentration and real spectra shift. Two experiments were designed correspondingly.
Process Test Experiment
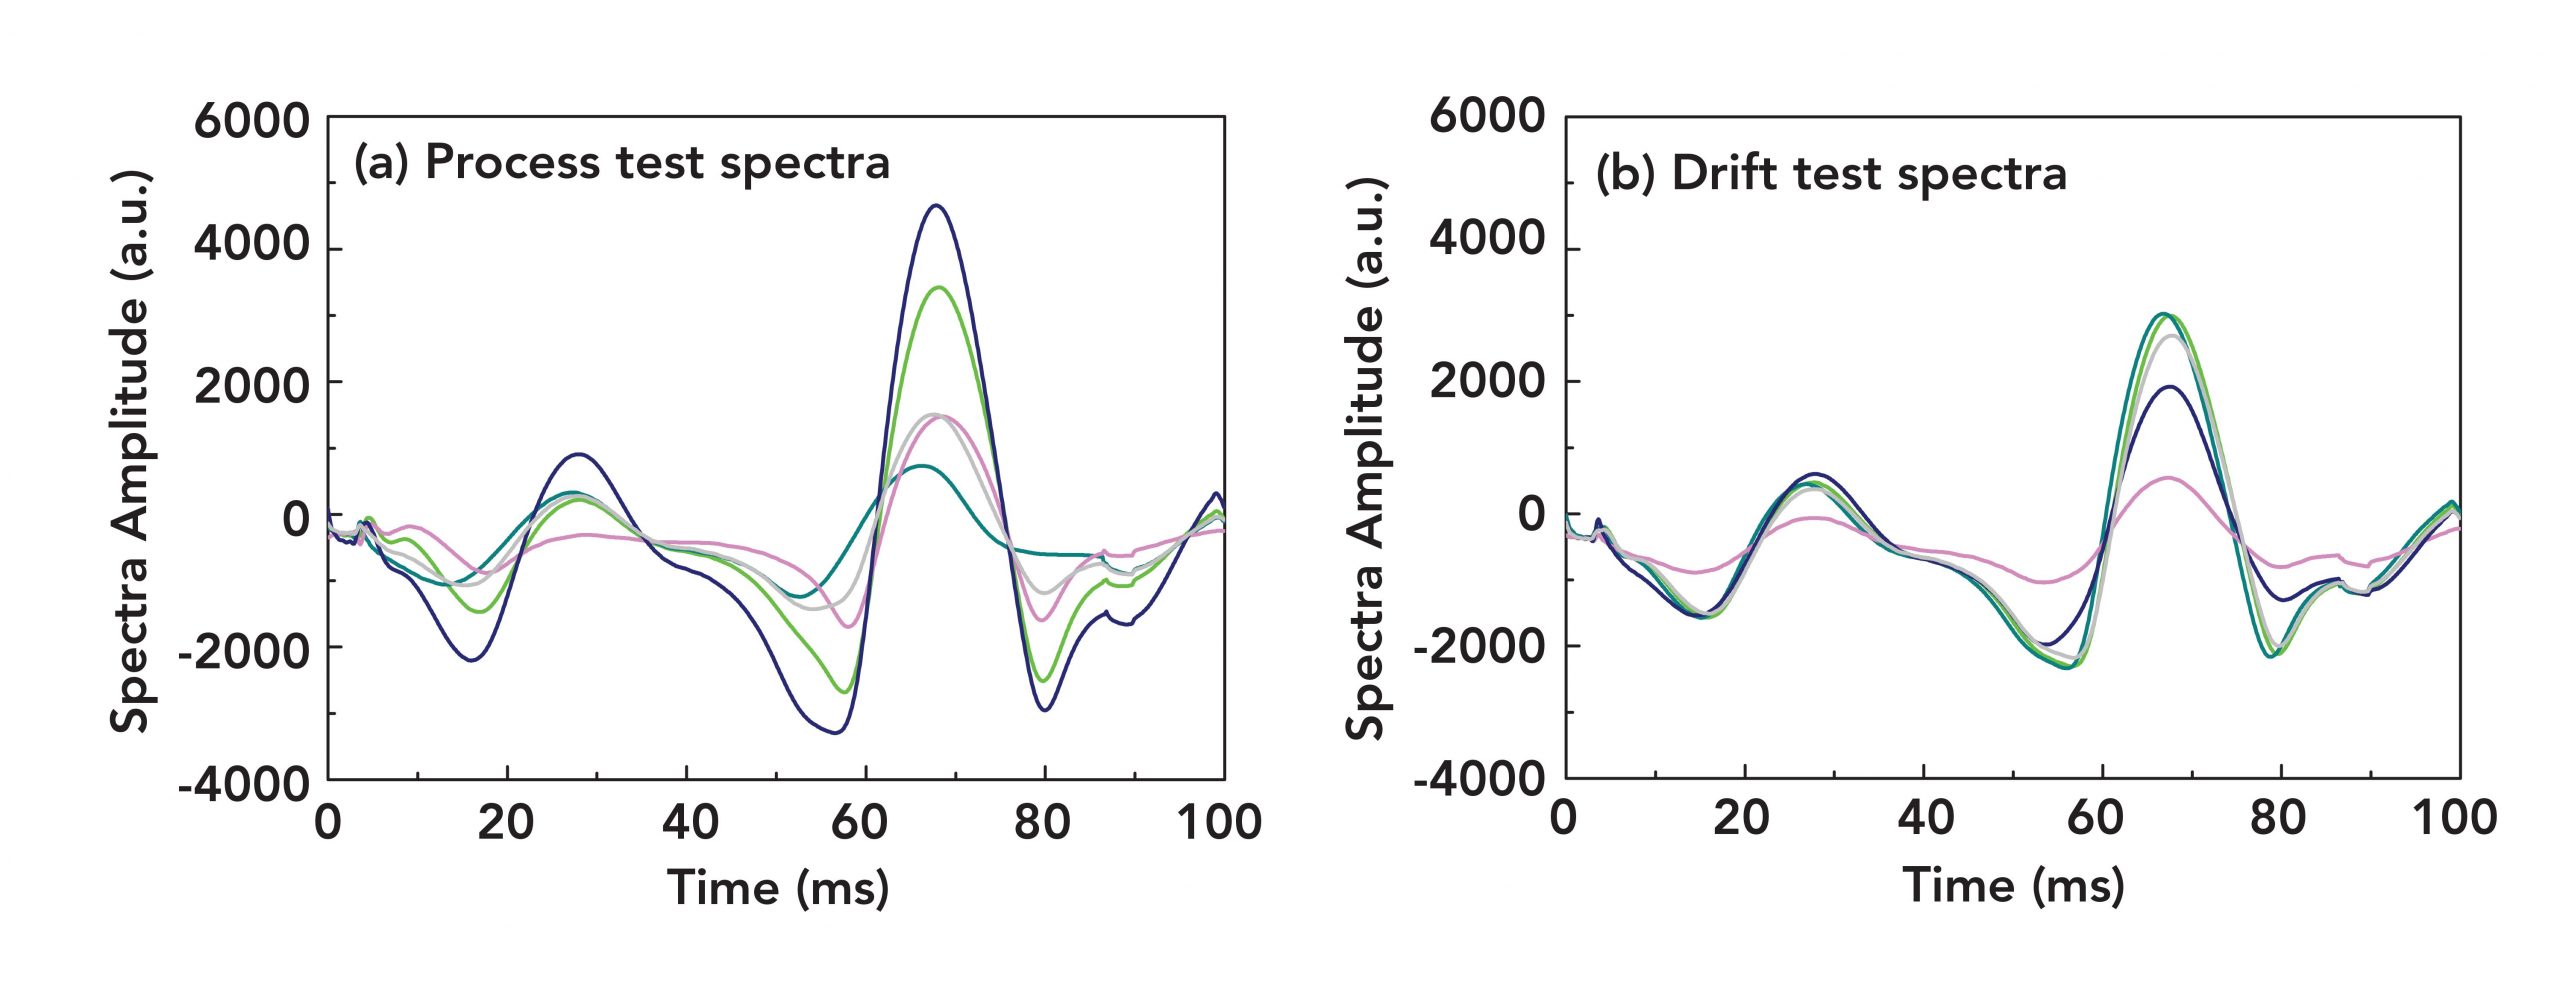
This experiment was to simulate the industrial process in a controlled scenario. Fifty mixing gas streams were generated with C2H4 up to 200 ppm, CH4 up to 2000 ppm and the pressure was in 900 to 1100 mbar range. They were randomly varied within the range. Part of collected spectra are plotted in Figure 2a. Because of CH4 interference, accurate concentration cannot be obtained by direct counting of the C2H4 spectra peak.
Spectral Drift Test Experiment
Spectral drift causes an adverse impact on the accuracy. In the experiment, spectral peak shift was varied up to 16 counts over 1000 counts range by randomly shifting current up to ±0.2 mA without changing the range amplitude. The concentration of C2H4 and CH4 was randomly set. Examples of collected spectra are shown in Figure 2b. For isolated spectral features, the spectral shift can be calculated by peak tracking of peak position, but it is unlikely to get correct spectral shift by tracking for this scenario shown in Figure 2b.
Results and Discussion
Process Test Analysis
The 50 process test spectra are used to calculate the C2H4 concentration in dynamic backgrounds with ELM. First, we evaluate the effect of activation functions, with subgroups 1 to 4 as a training set and subgroup 5 as a verification set. The RE for the different activation functions, sigmoid, sin, hardlim, tribas, radbas and rectified linear unit (ReLU), are calculated. The RE for ReLU is 0.65%, which is substantially better than others, because it has linear expression and broad linear response input range. Therefore, ReLU is chosen for future ELM modeling.
Then, Neuron number L is optimized at 150. After W and b are identified through GA global searching, RE is improved from 0.65% to 0.37%.
Finally, the impact of training set and verification selection on model performance is evaluated through a fivefold cross-validation (CV). The model was trained by the four subgroups, and verified by one remaining subgroup. The subgroups are rotated in training and verification selection. The RE of each subgroup with the corresponding ELM model is listed in Table I. The ELM model trained by subgroup 2–5 has the lowest RE of 0.27%.
The concentration error with the final optimized ELM modes for 50 spectra is plotted in Figure 3 (circle). The training set errors are closer to zero, because of deep suppression by the nonlinear activation function. The errors of 10 verification set spectra are larger, which are accountable for ELM model performance.
The C2H4 concentration is obtained by CLS equation 4. The RE is listed in Table I, with max value of 6.30%. Errors for each sample are plotted in Figure 3 (triangle). The error is reduced more by ELM than by CLS.
Spectral Drift Test Analysis
Spectra Shift Analysis with ELM
The real spectral shift in the dynamic process is the key to obtaining correct concentration through the calibration model. With real shift, spectra can be restored to calibration status with high fidelity. The ELM algorithm is adopted for this purpose. During model training, spectral shift is treated as the output in the model. The RE is defined as the current prediction error divided by the current shift range (Fs). The peak shift RE for subgroups is listed in Table II. The best ELM model, verified by subgroup 3, has an RE of 4%, equivalent to a maximum spectral shift error of 0.64 counts. The right C2H4 peak is selected for peak tracking with the RE listed in Table II. Due to concentration variation and CH4 interference, its accuracy is much less than ELM. The max error is 16 counts (-100%).
Concentration Error After Backshift Correction
After the shift calculation, the spectra are backshifted to match with the calibration. The C2H4 concentration prediction error with and without backshift correction is calculated based on corresponding calibration model.
The RE of C2H4 concentration for each spectrum is plotted against current shift in Figure 4. Before correction, the error pattern demonstrates a V shape. As spectra shift more, the error increases more. After ELM correction, the error pattern demonstrates a flat belt shape, and the widths are greatly shrunk. The error is improved from 6.92% to 1.50% (Figure 4a). For peak tracking and CLS method, the error has no obvious improvement (Figure 4b), due to inaccurate peak shift calculation.
Conclusion
ELM is employed in the trace C2H4 TDLAS analysis through two experiments. In the process test, RE of C2H4 concentration is obtained at 0.27% for the optimized ELM model. For the traditional CLS method, it is 6.30%. In the spectral shift test, the spectral shift prediction errors are less than 1 count for ELM, and less than 16 counts for peak tracking. The concentration relative error was reduced from 6.92% to 1.50% after ELM backshift correction. For the peak tracking and CLS methods, however, the error remains in the 20% region. ELM has demonstrated a dramatic robustness enhancement in trace C2H4 measurement. It can be extended to more complicated nonlinear spectral deformation scenarios.
Acknowledgments
This work is supported by Shandong Provincial Key RD projects (No. 2019GGX104103, 2019GHY112084).
References
(1) Y. Wei, J. Chang, J. Lian, and T. Liu, Photonic Sens. 5, 67–71 (2015).
(2) D. Shi, W. Song, J. Ye, B. Tao, and Y. Wang, Int. J. Turbo Jet-Engines 33, 95–104 (2016).
(3) Y. Wang, Y. Wei, J. Chang, T. Zhang, T. Liu, T. Sun, and K.T.V Grattan, IEEE Sens. J. 17, 4975–4982 (2017).
(4) Z.G. Yuan, X.T. Yang, W.Q. Xie, and X.M. Li, Spectrosc. Spectr. Anal. 38, 194–199 (2018).
(5) U. Michelucci and F. Venturini, Sensors 17, 2281 (2017).
(6) J. Li, B. Yu, and H. Fischer, Appl. Spectrosc. 69, 496–506 (2015).
(7) H. Li, Y. Zhu, F. Dong, X. Li, and L. Zhang, CPEM 2010 482–483 (2010).
(8) Y. Wang, Y. Wei, T. Liu, T. Sun, and K.T. Grattan, IEEE Sens. J. 18, 8587–8596 (2018).
(9) B.T. Le, D. Xiao, Y.C. Mao, L. Song, D.K. He, and S.J. Liu, Spectrosc. Spectr. Anal. 38, 2107–2112 (2018).
(10) T.O. Owolabi and M.A. Gondal, Anal. Chim. Acta 1030, 33–41 (2018).
(11) G.B. Huang, Q.Y. Zhu, and C.K. Siew, Neurocomputing 70, 489–501 (2006).
(12) G.B. Huang, D.H. Wang and Y. Lan, Int. J. Mach. Learn. Cybern. 2, 107–122 (2011).
(13) T. Yu, W. Cai, and Y. Liu, Rev. Sci. Instrum. 89, 43101 (2018).
(14) C. Malegori, E.J.N. Marques, S.T. de Freitas, M.F. Pimentel, C. Pasquini, and E. Casiraghi, Talanta 165, 112–116 (2017).
(15) X.X. Yin, S. Hadjiloucas, J. He, Y. Zhang, Y. Wang, and D. Zhang, Digit. Signal Process. 40, 40–52 (2015).
(16) K. Javed, R. Gouriveau, and N. Zerhouni, Neurocomputing 123, 299–307 (2014).
(17) G. Li, E. Dong, and W. Ji, Front. Phys. 7, 199 (2019).
Wenhai Ji, Kun Ma, Li Zhong, Ying Ma, and Guolin Li are with the College of Control Science and Engineering at the China University of Petroleum, in Qingdao, People’s Republic of China. Direct correspondence to: [email protected]


