A few years ago, Rory O’Driscoll of Scale Venture Partners, an early investor in Box, DocuSign, ExactTarget, and many other large enterprise SaaS companies, published a fascinating article titled ”Understanding the Mendoza Line for SaaS growth”. The key message of the article is that “… most of the time, growth rates only decline, but do so in a way that is on average fairly predictable.” Looking at the data from 21 SaaS companies, Rory estimated that the growth rate for any given year is between 80% and 85% of the growth rate in the prior year. He referred to this as growth persistence.
Tell me your current ARR and your ARR one year ago, and I’ll tell you when you’ll hit $100M in ARR…?
An intriguing implication of this observation is that if you assume growth persistence to be constant over a company’s lifetime, you can predict its future growth based on its ARR number of three consecutive years. What’s more, if you assume that growth persistence is pretty universal across SaaS companies, you need only two ARR numbers to predict a company’s trajectory.
Using a growth persistence estimate of 82%, and assuming that to be IPO-able you have to be at $100M in ARR while still growing 25% or more in the following year, Rory calculated the “Mendoza Line for SaaS growth”:
The theory behind the Mendoza Line is compelling, and the fact that growth rates tend to decline as companies get larger seems to support it. But is it actually true? As Rory emphasized, it is a rule of thumb that works well on average, recognizing that there are exceptions:
“This is a heuristic, not a law of physics.”
Many of our portfolio companies had a slow start, ups and downs, or a bad year at some points in their lives but were able to reignite growth again later on. This includes several SaaS companies that are on track to hit $100M ARR in the next 1–2 years. Oh, and almost none of these unicorns in the making followed the T2D3 path. Narrative violation? 😉 In any case, I became curious to find out more about how useful the heuristic is, so I decided to do some number crunching.
I’ve looked into two datasets:
1) Public SaaS companies
- I used ARR data from Public Comps (an excellent resource for SaaS metrics!) on 75 publicly listed SaaS companies. For the (many) SaaS companies that don’t report ARR, ARR is approximated based on the reported revenue numbers.
- In total, I extracted 218 data pairs (of the “ARR growth of company XYZ in year n / ARR growth of company XYZ in year n+1” type).
- Since companies rarely provide revenue data for more than one or two years leading up to the IPO, ARR data below $50–100M or so is usually not available. Most of the data pairs correspond to hundreds of millions in ARR.
- The oldest data pair is from 2012/2013 (ServiceNow, in case you’re curious), but the vast majority of data pairs are from 2014–2019. The analysis is based on year-end ARR data, so it doesn’t include any 2020 numbers.
2) P9 Family SaaS companies
- The analysis is based on 96 data pairs from 29 companies.
- I’ve excluded data points below $100k ARR. The majority of data pairs correspond to $1–20M ARR, but there’s a significant number in the $20–100M range.
- The analysis is based on September ARR. Most data pairs are from 2014–2020.
Compared to Scale’s data, the public market dataset is from much later-stage companies, while the P9 Family data is from a much earlier-stage portfolio.
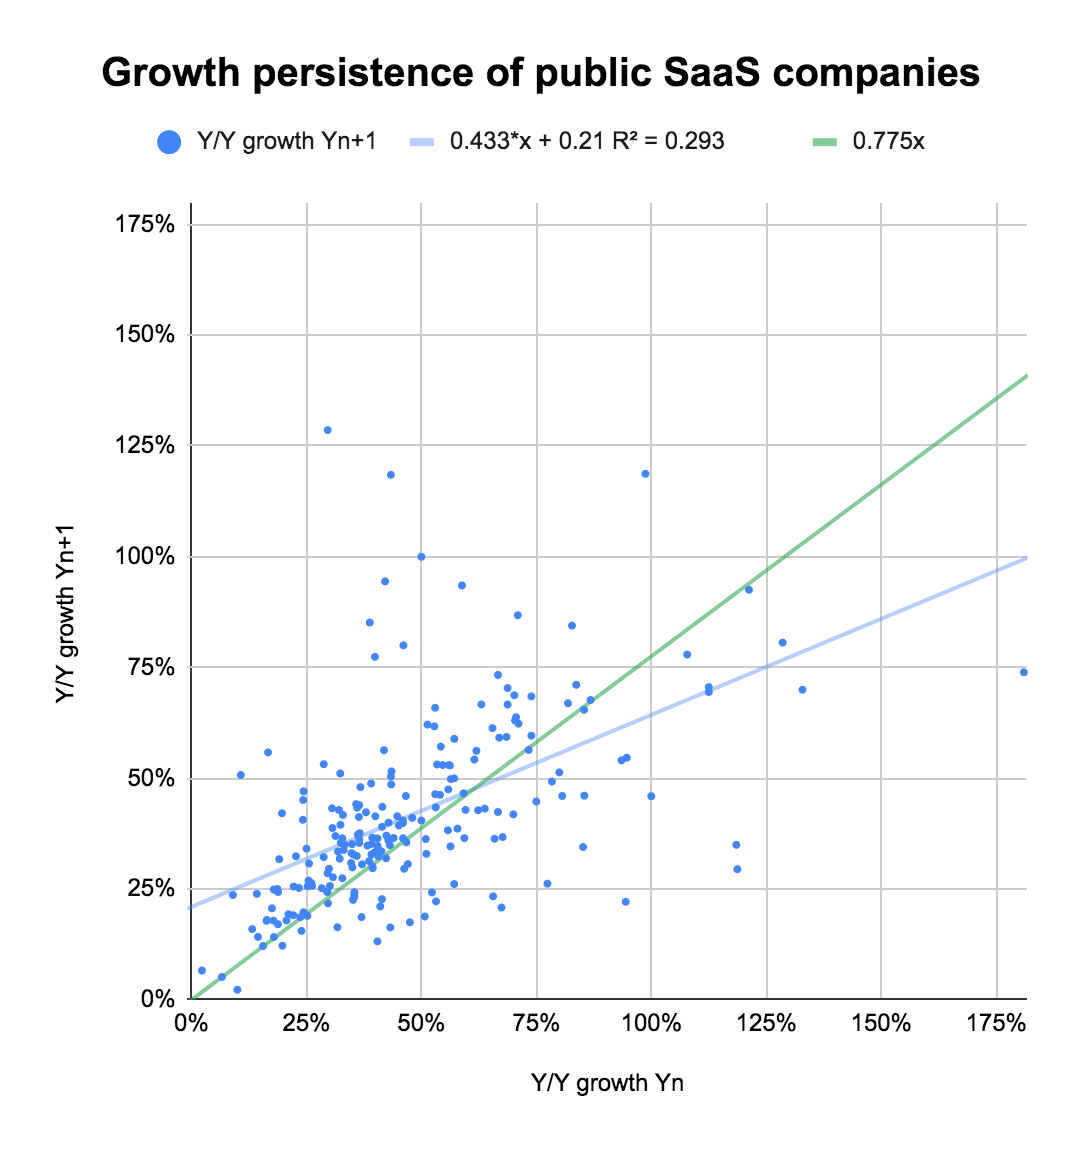
Plotting the data points from the first dataset gives us this scatter chart:
The blue trendline tells you that if you grow x percent in any given year, you can expect to grow 0.43 times x plus 21 percent in the following year.¹⁾ If we force the regression line to go through (0,0) to make it more comparable with Scale’s analysis, we get the green trendline, which has a slope of 0.775, quite close to the 80–85% from Scale’s research.²⁾ The correlation between the growth rate in any given year and the following year is 0.54.
Depending on the model you’re using to fit the data (y=ax+b or y=ax), the slope of the line is quite different, and it’s not entirely clear (at least to me) which function is the best representation of reality. So let’s look at the data in a different way:
To create this view, I’ve put all data pairs into one of 12 buckets based on the change in growth from year n to year n+1. Note that I’m using percentage points here, so “minus 20–30%”, for example, means a slowdown from, say, 70% to 40–50%.
What you can see here is that for more than one-third of the data pairs, the company’s ARR growth rate has increased from one year to the next year. In most of these cases, the acceleration was minor (0–10%), but still, it’s remarkable that a rule of thumb, which most investors consider an obvious truth, seems to be wrong one out of three times. If you ever have a bad year, don’t despair. There is hope. 🙂 ³⁾
The median growth persistence in the public company dataset is 89%, but if you look at this histogram, you’ll see a huge variance:
Only 71 out of 218 data pairs are in the 80–100% bucket, so based on this dataset, growth persistence is not a universal constant across companies. Looking at the raw data company-by-company, I can see a lot of variation of growth persistence across companies’ lifetimes as well, so it doesn’t look like growth persistence is somehow built into companies’ DNAs either.
Next, let’s look at the SaaS companies in P9’s portfolio. As a reminder, most of the data is from the $1–20M ARR range, but there’s a significant number of data pairs in the $20–100M range.


