GLOBAL RESEARCH SYNDICATE
No Result
View All Result
  • Login
  • Latest News
  • Consumer Research
  • Survey Research
  • Marketing Research
  • Industry Research
  • Data Collection
  • More
    • Data Analysis
    • Market Insights
  • Latest News
  • Consumer Research
  • Survey Research
  • Marketing Research
  • Industry Research
  • Data Collection
  • More
    • Data Analysis
    • Market Insights
No Result
View All Result
globalresearchsyndicate
No Result
View All Result
Home Data Analysis

Anscombe’s Quartet And Importance of Data Visualization

globalresearchsyndicate by globalresearchsyndicate
January 6, 2021
in Data Analysis
0
Anscombe’s Quartet And Importance of Data Visualization
0
SHARES
10
VIEWS
Share on FacebookShare on Twitter

Author profile picture

@imsparshSparsh Gupta

Technologist. Programmer. Musician. Explorer.

Anscombe’s quartet comprises four data sets that have nearly identical simple descriptive statistics, yet have very different distributions and appear very different when graphed.
— Wikipedia

Anscombe’s Quartet can be defined as a group of four data sets which are nearly identical in simple descriptive statistics, but there are some peculiarities in the dataset that fools the regression model if built. They have very different distributions and appear differently when plotted on scatter plots.

It was constructed in 1973 by statistician Francis Anscombe to illustrate the importance of plotting the graphs before analyzing and model building, and the effect of other observations on statistical properties.

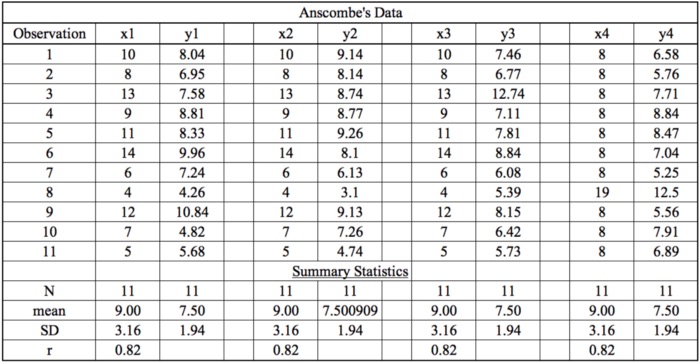
There are these four data set plots which have nearly same statistical observations, which provides same statistical information that involves variance, and mean of all x,y points in all four datasets.

This tells us about the importance of visualising the data before applying various algorithms out there to build models out of them which suggests that the data features must be plotted in order to see the distribution of the samples that can help you identify the various anomalies present in the data like outliers, diversity of the data, linear separability of the data, etc.

Also, the Linear Regression can be only be considered a fit for the data with linear relationships and is incapable of handling any other kind of datasets.

These four plots can be defined as follows:

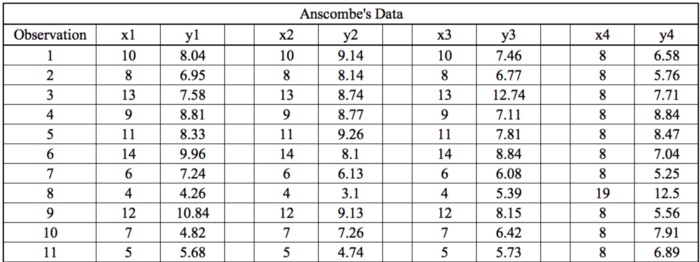
The statistical information for all these four datasets are approximately similar and can be computed as follows:

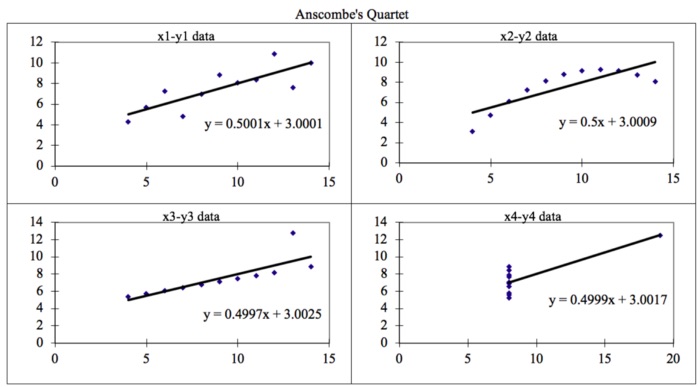
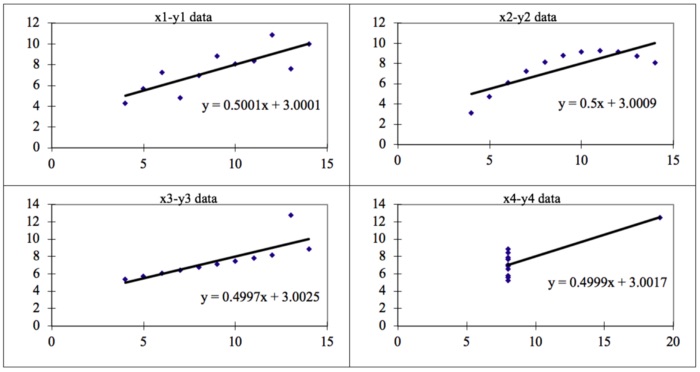
When these models are plotted on a scatter plot, all datasets generates a different kind of plot that is not interpretable by any regression algorithm which is fooled by these peculiarities and can be seen as follows:

The four datasets can be described as:

  • Dataset 1: this fits the linear regression model pretty well.
  • Dataset 2: this could not fit linear regression model on the data quite well as the data is non-linear.
  • Dataset 3: shows the outliers involved in the dataset which cannot be handled by linear regression model.
  • Dataset 4: shows the outliers involved in the dataset which cannot be handled by linear regression model.

Conclusion

We have described the four datasets that were intentionally created to describe the importance of data visualisation and how any regression algorithm can be fooled by the same. Hence, all the important features in the dataset must be visualised before implementing any machine learning algorithm on them which will help to make a good fit model.

Thanks for reading. You can find my other Machine Learning related posts here.

I hope this post has been useful. I appreciate feedback and constructive criticism. If you want to talk about this article or other related topics, you can drop me a text here or at LinkedIn.

Previously published under a paywall.

Related

Tags

Join Hacker Noon

Create your free account to unlock your custom reading experience.

Related Posts

How Machine Learning has impacted Consumer Behaviour and Analysis
Consumer Research

How Machine Learning has impacted Consumer Behaviour and Analysis

January 4, 2024
Market Research The Ultimate Weapon for Business Success
Consumer Research

Market Research: The Ultimate Weapon for Business Success

June 22, 2023
Unveiling the Hidden Power of Market Research A Game Changer
Consumer Research

Unveiling the Hidden Power of Market Research: A Game Changer

June 2, 2023
7 Secrets of Market Research Gurus That Will Blow Your Mind
Consumer Research

7 Secrets of Market Research Gurus That Will Blow Your Mind

May 8, 2023
The Shocking Truth About Market Research Revealed!
Consumer Research

The Shocking Truth About Market Research: Revealed!

April 25, 2023
market research, primary research, secondary research, market research trends, market research news,
Consumer Research

Quantitative vs. Qualitative Research. How to choose the Right Research Method for Your Business Needs

March 14, 2023
Next Post
Global Chemical Analytical & Consulting Services Market (2020-2026) | Latest COVID19 Impact Analysis | Know About Brand Players: American Assay Laboratories, American Research & Testing Inc., S & N Labs, Process Technology Consulting, Imagineering Finishing Technologies, etc.

Mobile Data Collector Market Statistics and Research Analysis Released in Latest Industry Report 2020 | Coronavirus-COVID19 Impact Analysis With Top Manufacturers Analysis: Siemens, Opticon USA, SDSpro, doForms, Poimapper, etc.

Categories

  • Consumer Research
  • Data Analysis
  • Data Collection
  • Industry Research
  • Latest News
  • Market Insights
  • Marketing Research
  • Survey Research
  • Uncategorized

Recent Posts

  • Ipsos Revolutionizes the Global Market Research Landscape
  • How Machine Learning has impacted Consumer Behaviour and Analysis
  • Market Research: The Ultimate Weapon for Business Success
  • Privacy Policy
  • Terms of Use
  • Antispam
  • DMCA

Copyright © 2024 Globalresearchsyndicate.com

Welcome Back!

Login to your account below

Forgotten Password?

Retrieve your password

Please enter your username or email address to reset your password.

Log In
This website uses cookies to improve your experience. We'll assume you're ok with this, but you can opt-out if you wish. Cookie settingsACCEPT
Privacy & Cookies Policy

Privacy Overview

This website uses cookies to improve your experience while you navigate through the website. Out of these cookies, the cookies that are categorized as necessary are stored on your browser as they are essential for the working of basic functionalities of the website. We also use third-party cookies that help us analyze and understand how you use this website. These cookies will be stored in your browser only with your consent. You also have the option to opt-out of these cookies. But opting out of some of these cookies may have an effect on your browsing experience.
Necessary
Always Enabled
Necessary cookies are absolutely essential for the website to function properly. This category only includes cookies that ensures basic functionalities and security features of the website. These cookies do not store any personal information.
Non-necessary
Any cookies that may not be particularly necessary for the website to function and is used specifically to collect user personal data via analytics, ads, other embedded contents are termed as non-necessary cookies. It is mandatory to procure user consent prior to running these cookies on your website.
SAVE & ACCEPT
No Result
View All Result
  • Latest News
  • Consumer Research
  • Survey Research
  • Marketing Research
  • Industry Research
  • Data Collection
  • More
    • Data Analysis
    • Market Insights

Copyright © 2024 Globalresearchsyndicate.com