
US Dollar, AUD/USD, EUR/USD, NZD/USD, USD/CAD – Talking Points:
- AUD/USD consolidating below key resistance.
- Ascending Channel guiding EUR/USD rates higher.
- NZD/USD gearing up to retest the yearly high.
- Descending Channel capping USD/CAD’s upside potential.
As mentioned in previous reports, the anti-risk US Dollar may continue to lose ground against its major counterparts, as long-term price analysis suggests a cyclical downturn is in the offing. Here are the key levels to watch for AUD/USD, EUR/USD, NZD/USD and USD/CAD rates.
AUD/USD Daily Chart – Consolidating Below Key Resistance
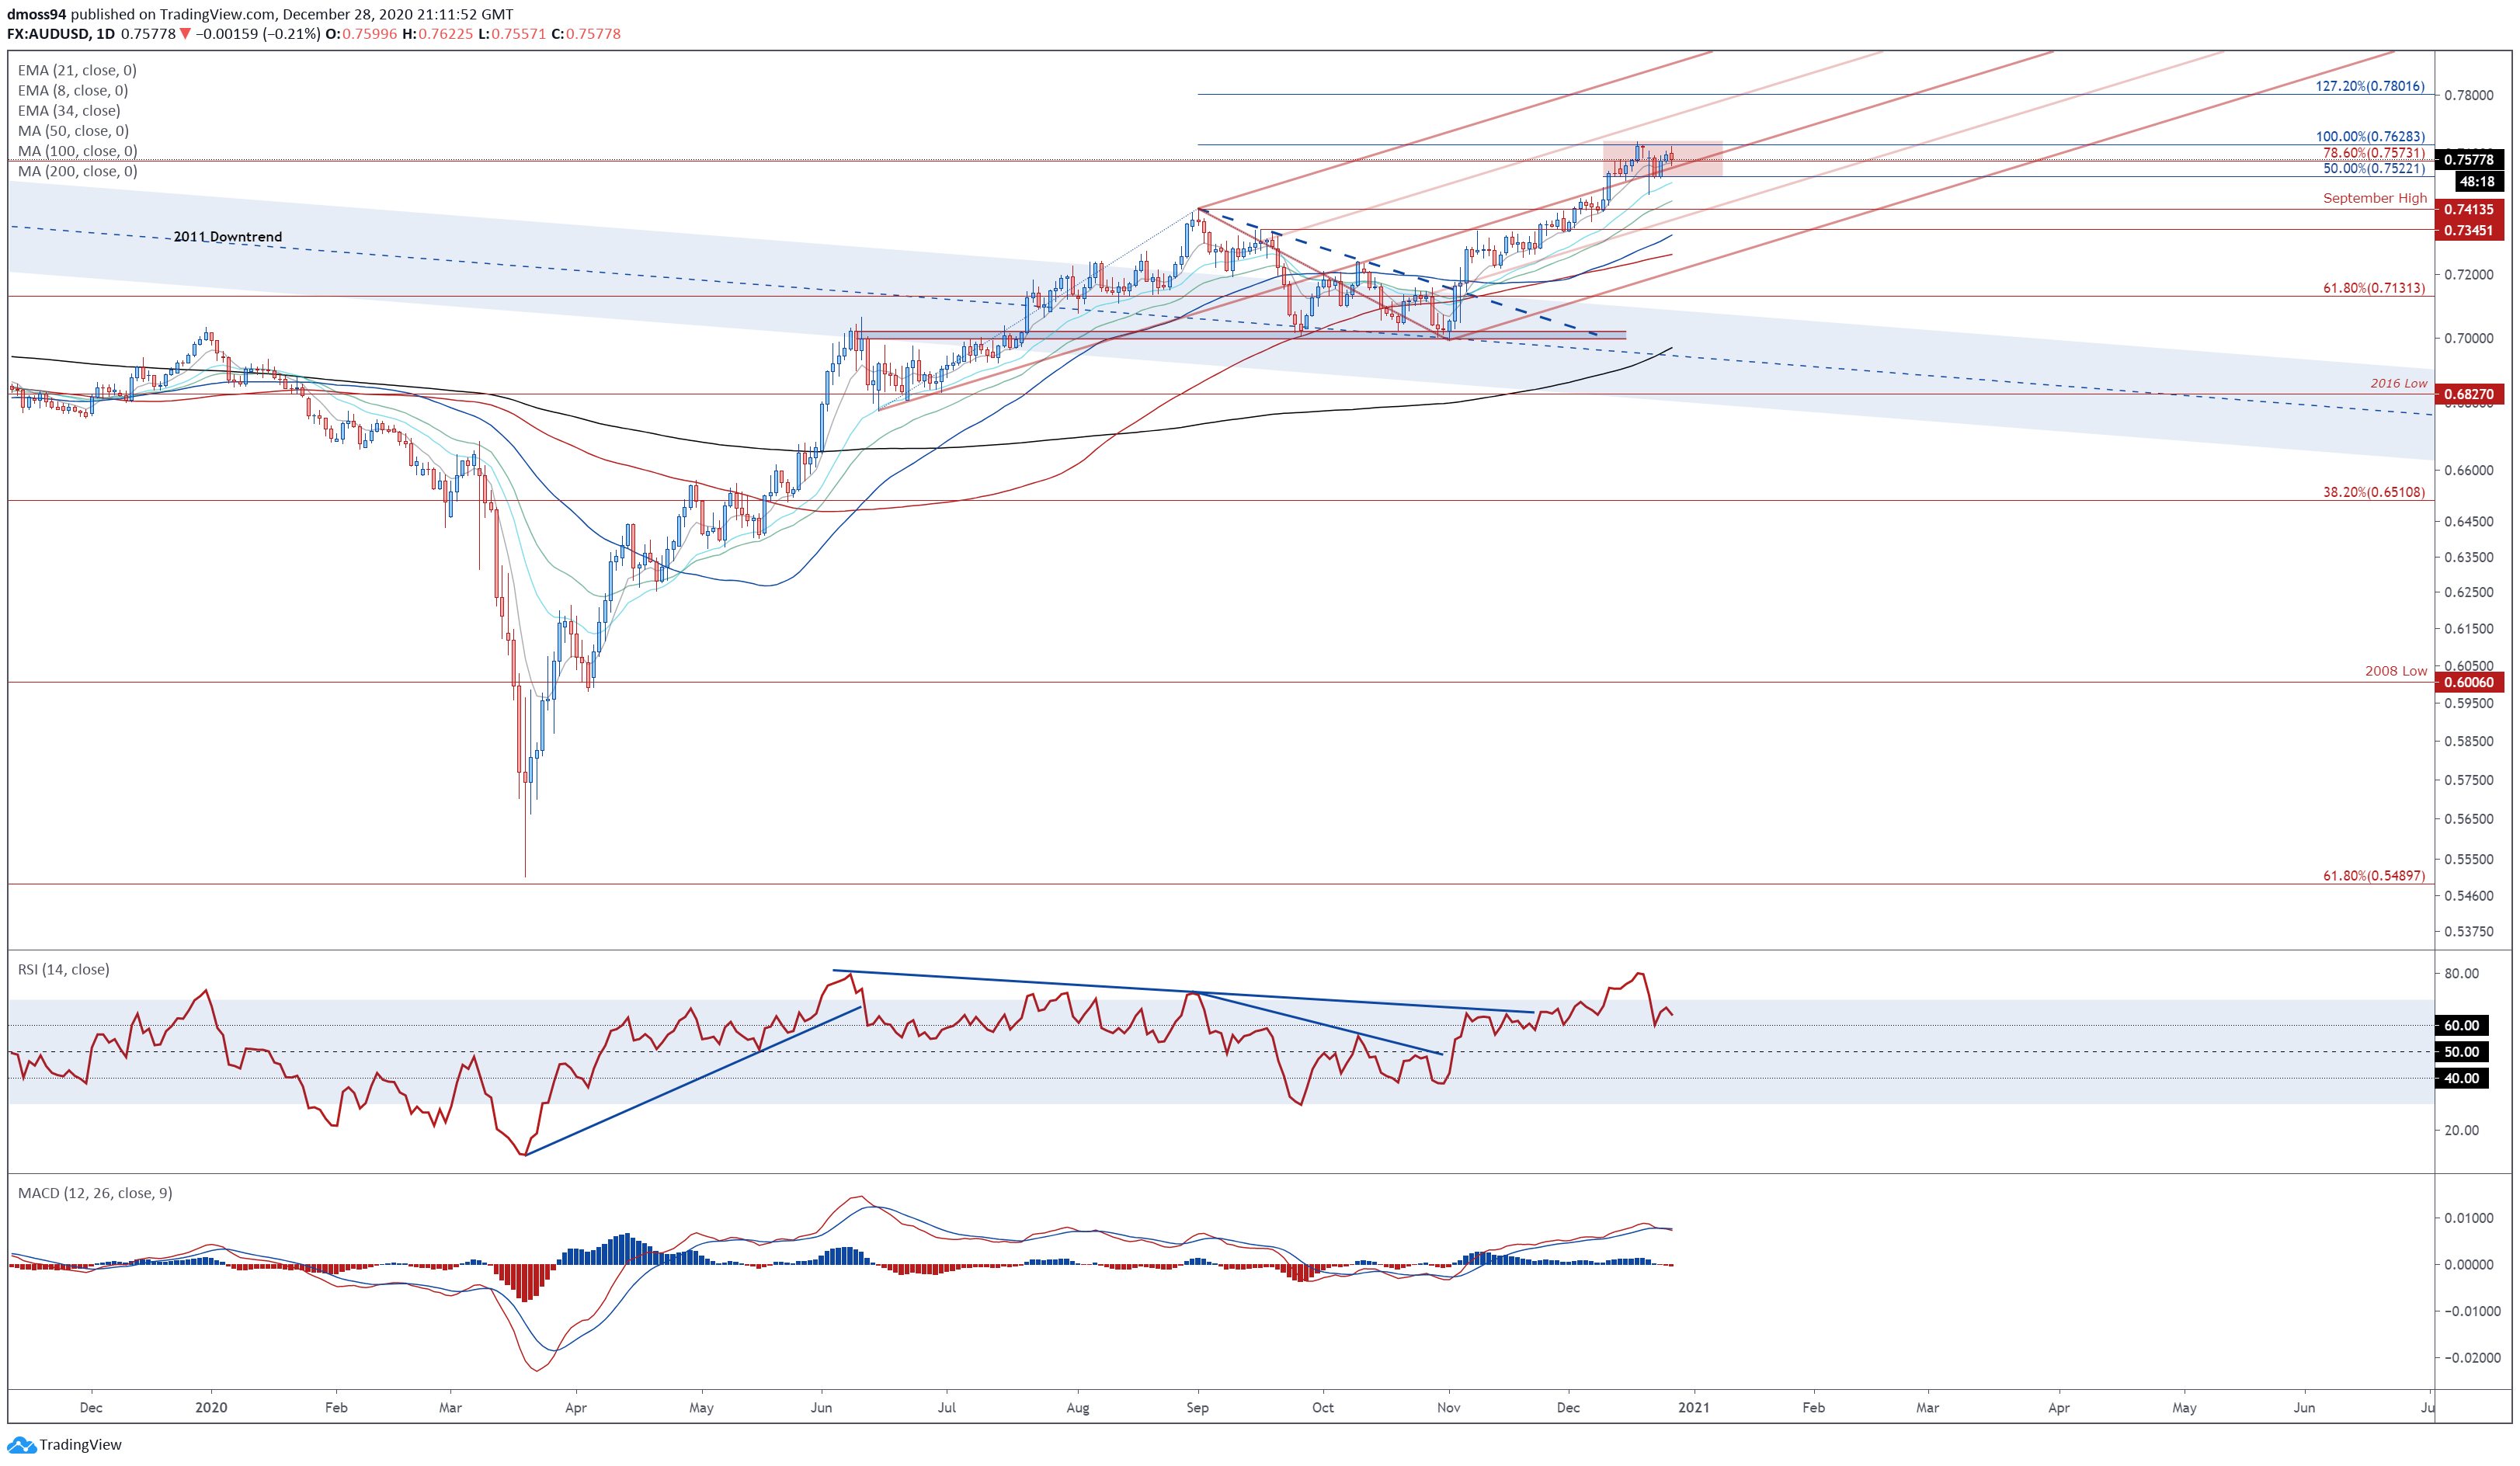
AUD/USD daily chart created using Tradingview
Although AUD/USD rates have struggled to gain a firm foothold above key psychological resistance at 0.7600, the technical outlook for the cyclically-sensitive exchange rate continues to favour further gains.
Bullish moving average stacking, in tandem with the RSI and MACD indicator tracking firmly above their respective neutral midpoints, hint at swelling bullish momentum.
Moreover, with price perched constructively above confluent support at the 50% Fibonacci (0.7522) and Pitchfork median line, AUD/USD appears to be carving out a Bull Flag continuation pattern.
With that in mind, a daily close above the 100% Fibonacci (0.7628) would likely signal the resumption of the primary uptrend and carve a path for price to test the psychologically imposing 0.7800 mark. The Bull Flag’s implied measured move suggesting prices could climb a further 3.9% to probe 0.7860.
Alternatively, sliding back below the December 23 low (0.7516) may neutralize near-term buying pressure and ignite a pullback towards the December 7 high (0.7454).
| Change in | Longs | Shorts | OI |
| Daily | 17% | -4% | 4% |
| Weekly | 34% | -4% | 9% |
EUR/USD Daily Chart – Ascending Channel Guiding Price Higher
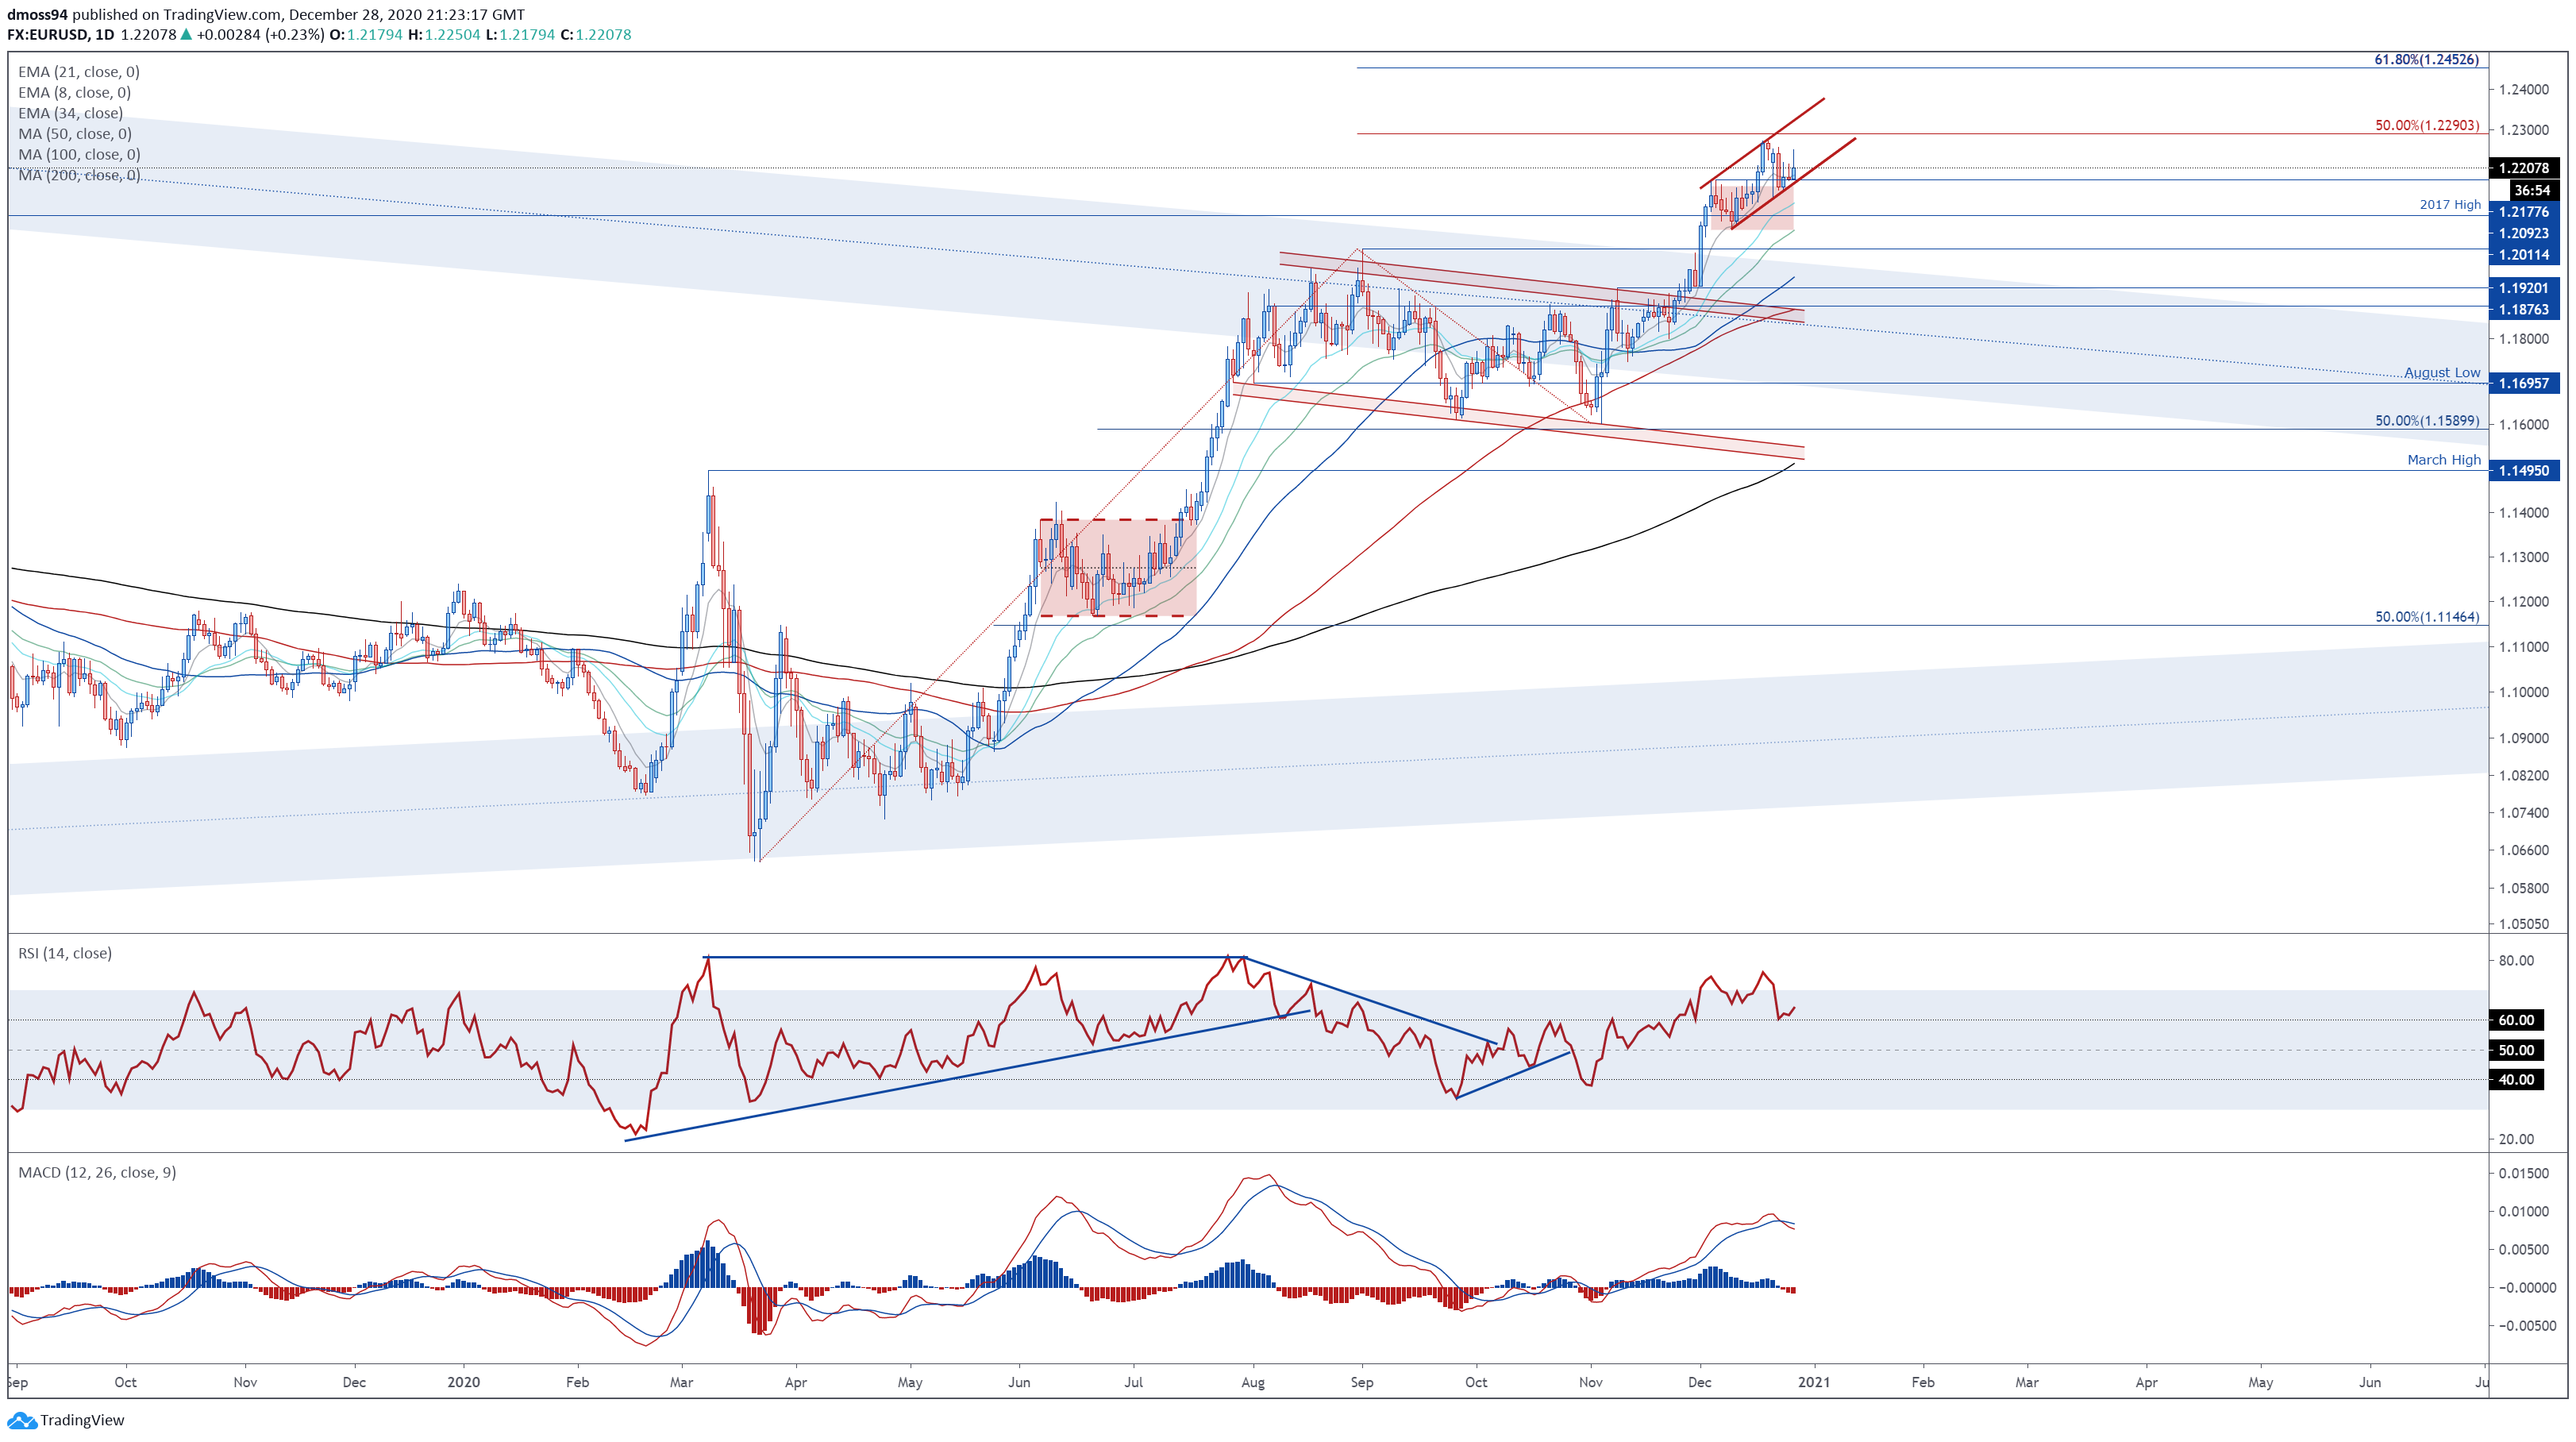
EUR/USD daily chart created using Tradingview
EUR/USD rates also seem poised to probe the yearly high in the coming days, as prices bounce away from Bull Flag resistance-turned-support and continue to track within the confines of an Ascending Channel.
With the RSI hovering above 60 and the MACD indicator travelling at its highest levels since August, the path of least resistance seems skewed to the topside. If support at the December 4 high (1.2178) remains intact, a push to challenge the yearly high (1.2272) looks relatively likely.
A daily close above the 50% Fibonacci (1.2290) probably ignites a more extended topside push and brings the 61.8% Fibonacci (1.2453) into focus. On the other hand, a daily close back below 1.2160 could open the door for a short-term correction towards the 2017 high (1.2093).
| Change in | Longs | Shorts | OI |
| Daily | 5% | 2% | 3% |
| Weekly | 28% | -11% | 0% |
NZD/USD Daily Chart – Short-Term Pullback in the Offing?
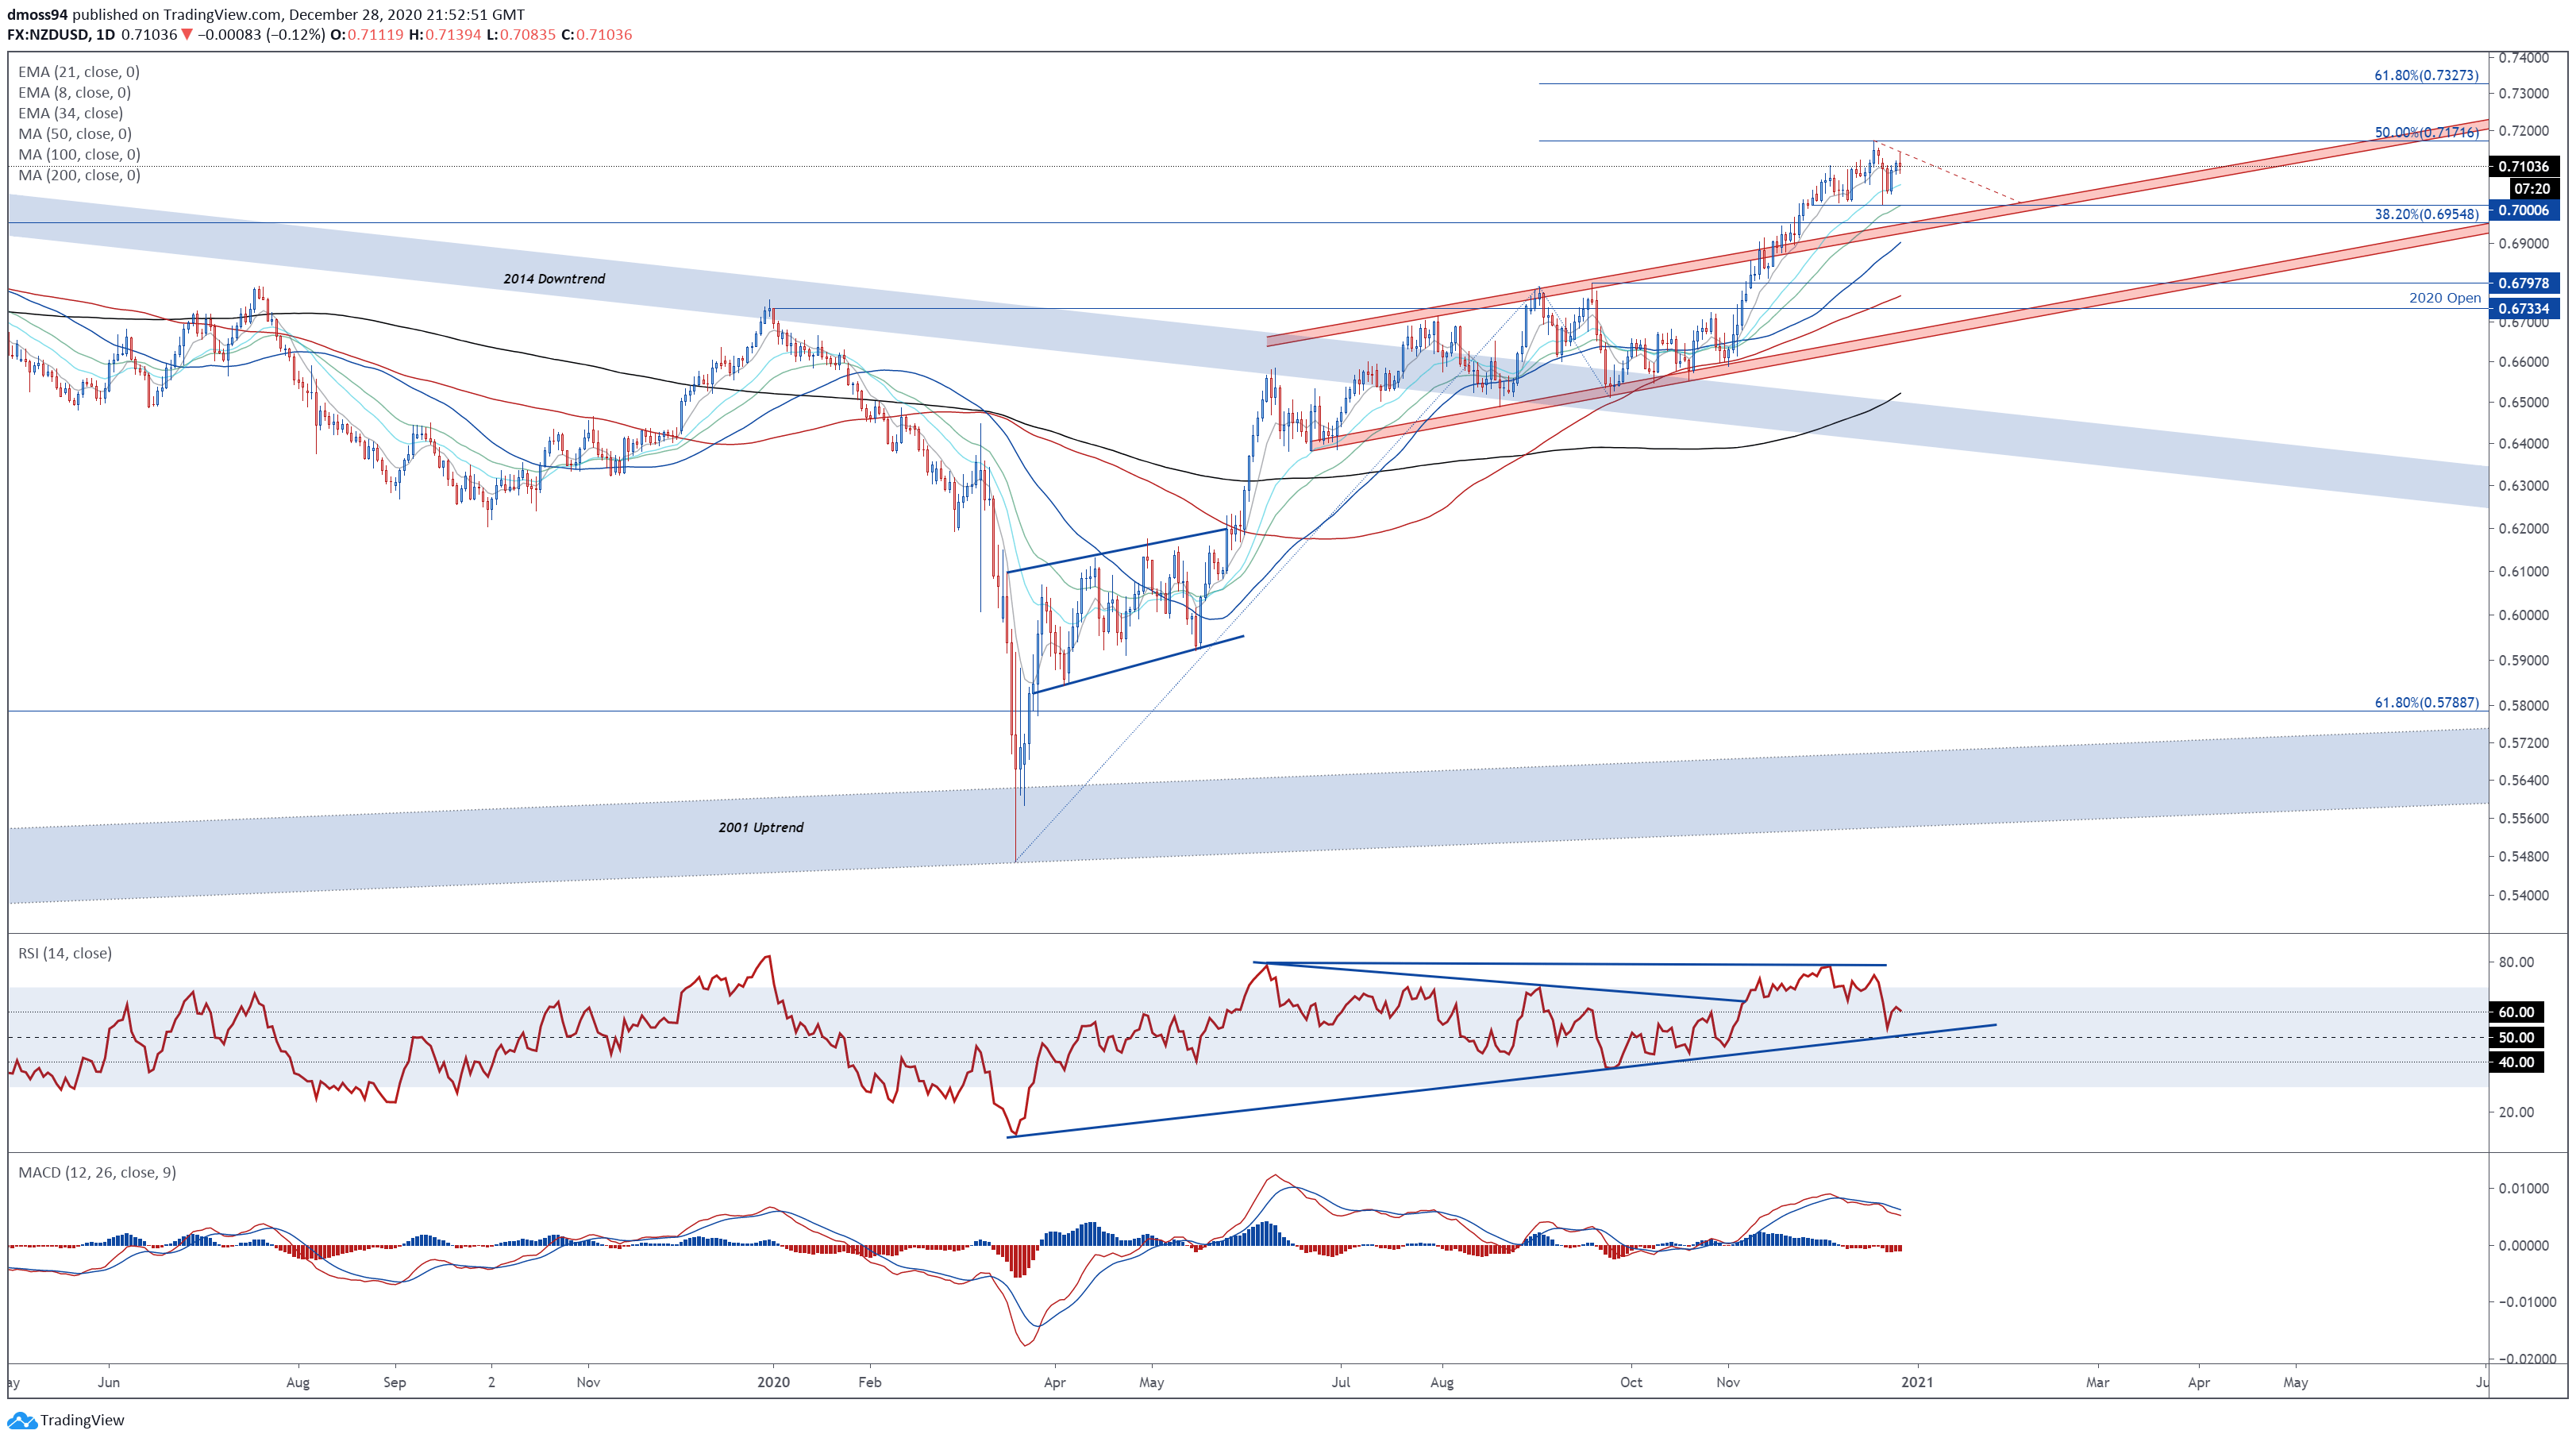
NZD/USD daily chart created using Tradingview
The NZD/USD exchange rate looks poised to extend its recent pullback from the yearly high (0.7172) set on December 17, as prices struggle to above the psychologically pivotal 0.7100 mark.
With the RSI dipping below 60, and the slope of the MACD indicator notably declining, a short-term correction lower could be in the offing. However, with prices tracking above all six moving averages, an extended downside push seems relatively unlikely.
Nevertheless, failing to gain a firm foothold above 0.7150 on a daily close basis could trigger a pullback towards the November high (0.7051), with a break below carving a path to probe support at the December 21 low (0.7002).
Conversely, clearing resistance at the 50% Fibonacci (0.7172) would probably signal the resumption of the primary uptrend and open the door for buyers to drive price towards 0.7300.
| Change in | Longs | Shorts | OI |
| Daily | 15% | -2% | 3% |
| Weekly | 44% | -2% | 9% |
USD/CAD Daily Chart – Descending Channel Capping Upside
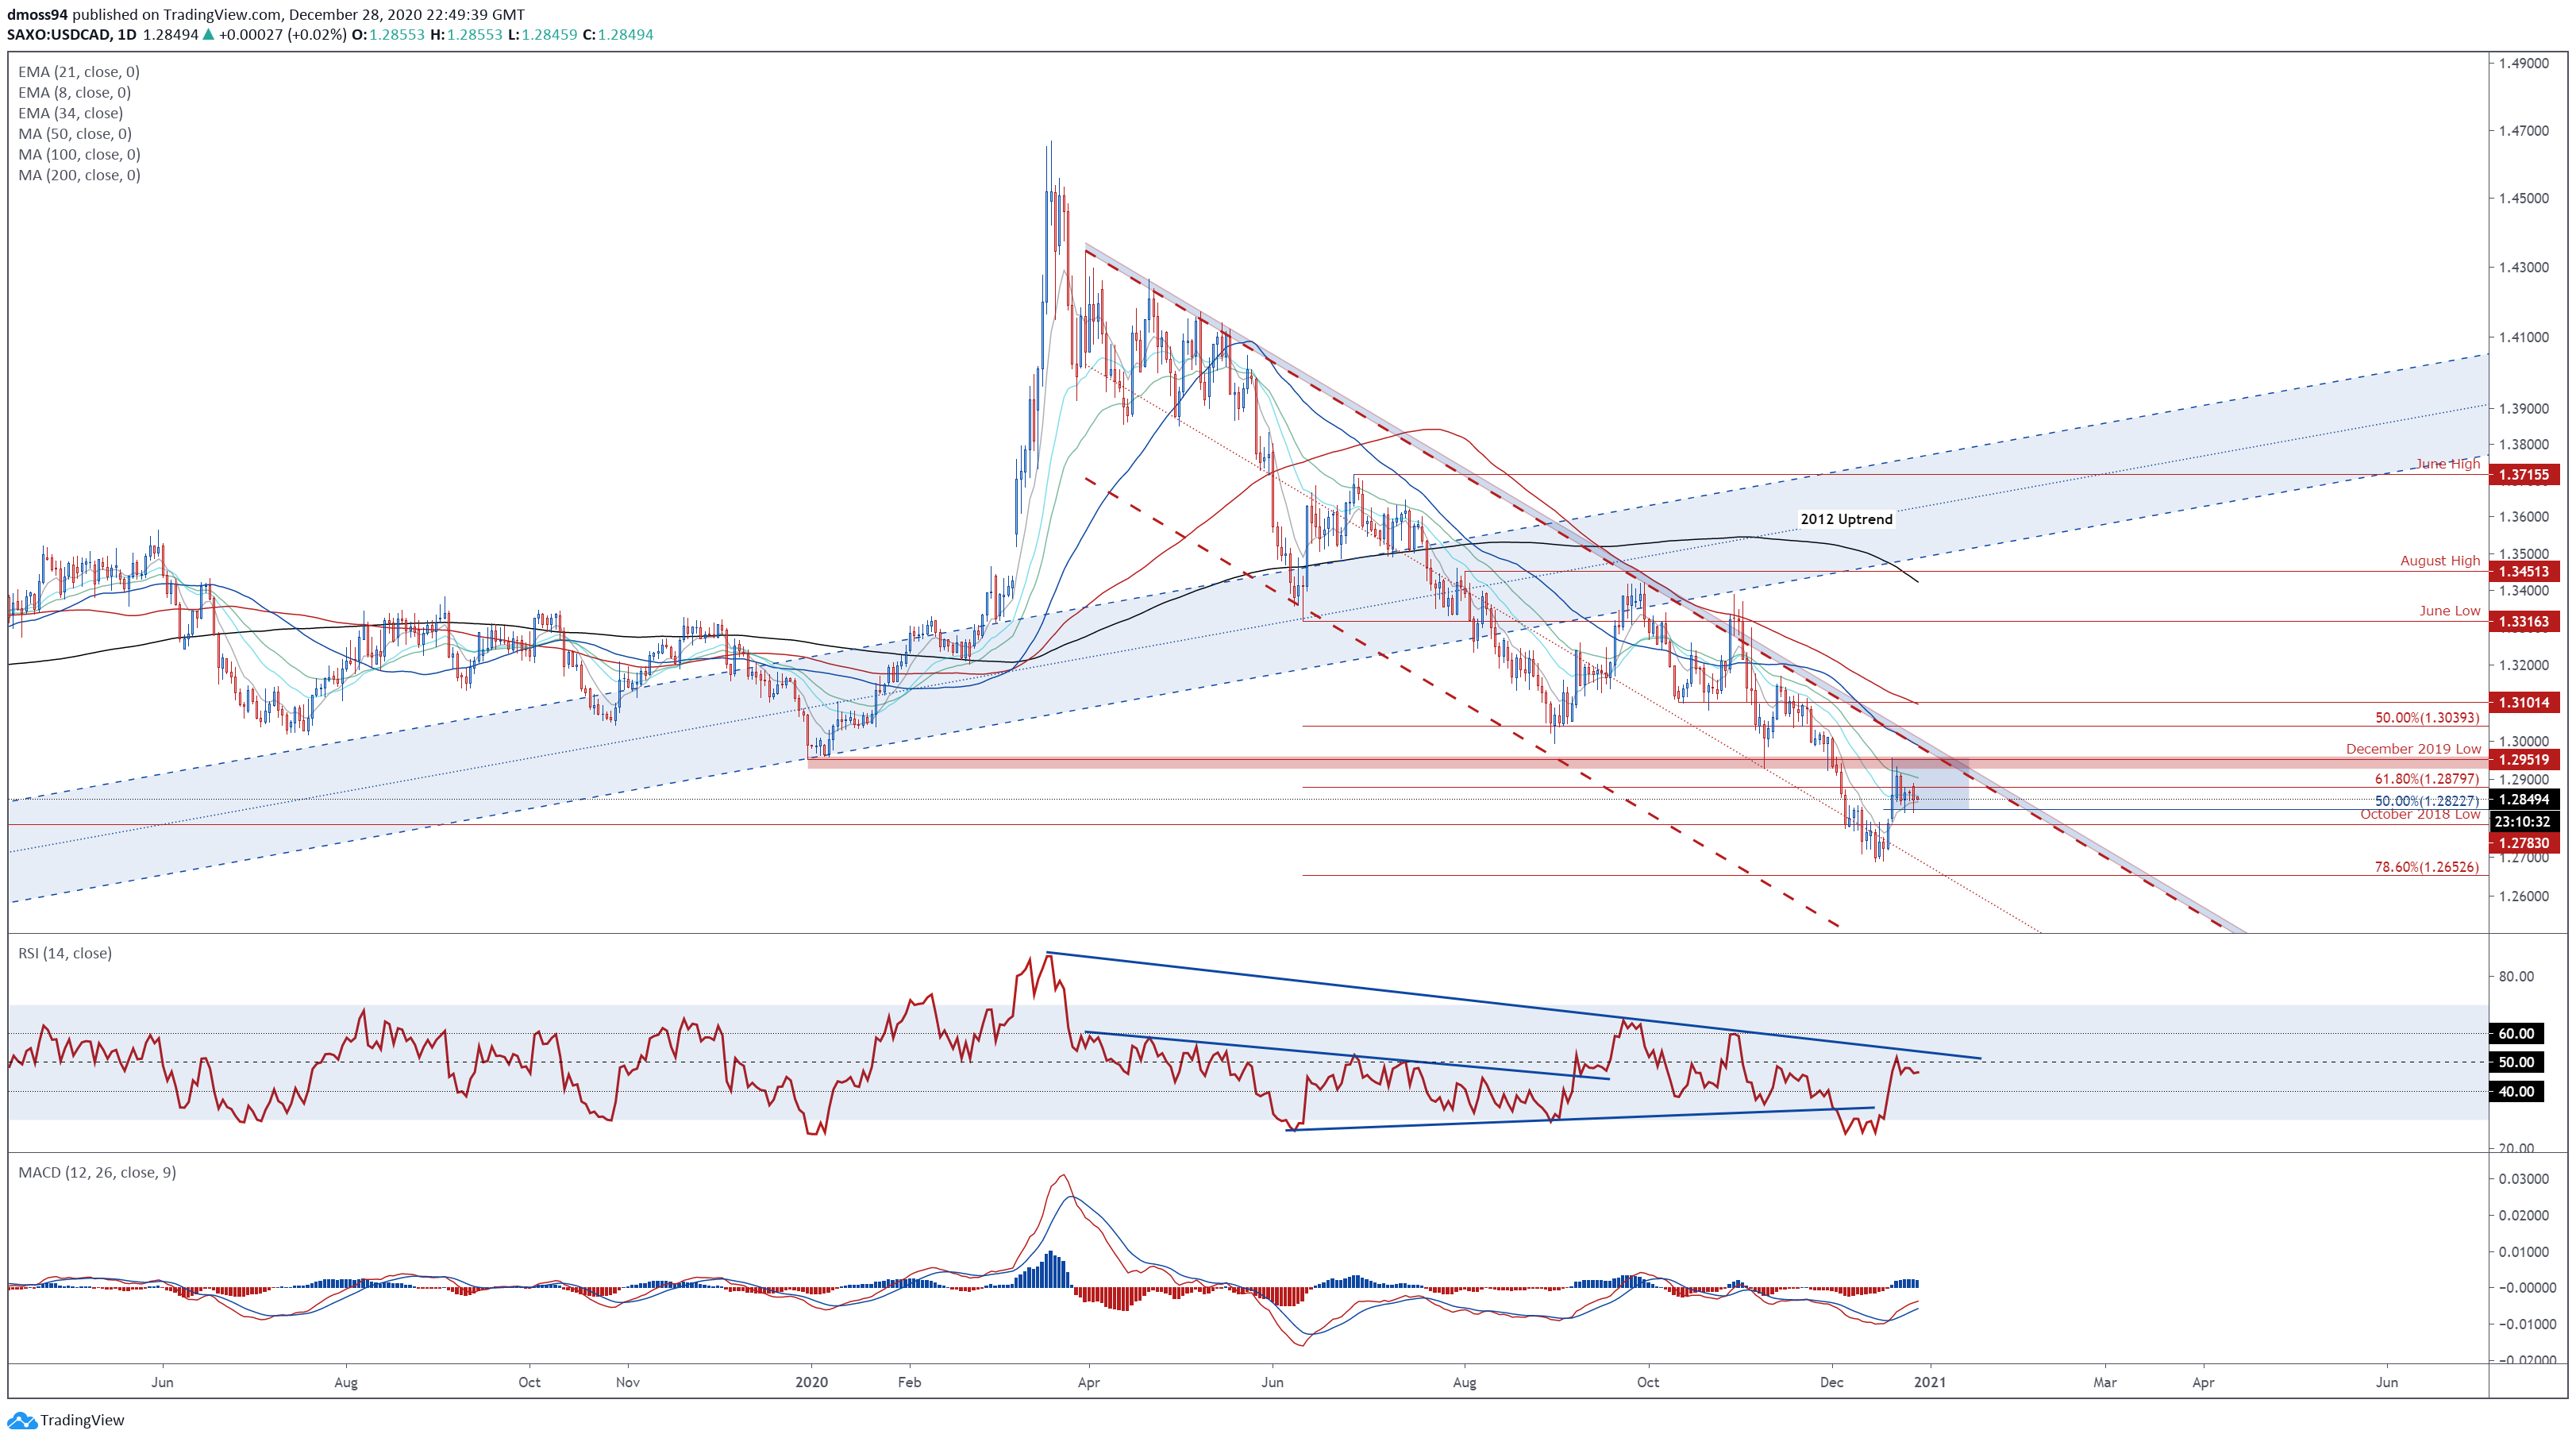
USD/CAD daily chart created using Tradingview
USD/CAD rates may be gearing up to retest the resistance zone at 1.2930 – 1.2950, as prices carve out a Bull Flag pattern above key support at 1.2800.
A bullish crossover on the MACD indicator, in tandem with the RSI eyeing a push back above its neutral midpoint, hint at swelling bullish momentum. However, with the exchange rate continuing to track within the confines of a Descending Channel, the longer-term outlook remains skewed to the downside.
Nevertheless, pushing back above the 61.8% Fibonacci (1.2880) could open the door for buyers to probe flag resistance at 1.2956. Clearing that probably neutralizes near-term selling pressure and brings the 100-day moving average (1.3097) into the cross hairs.
The bullish pattern’s implied measured move suggesting USD/CAD could climb a further 3% from current levels to probe the 1.2300 mark. On the contrary, sliding back below the December 24 low (1.2813) would likely signal the resumption of the primary downtrend and carve a path for sellers to retest the yearly low (1.2688).
| Change in | Longs | Shorts | OI |
| Daily | 5% | 7% | 6% |
| Weekly | 0% | 16% | 5% |
— Written by Daniel Moss, Analyst for DailyFX
Follow me on Twitter @DanielGMoss

Recommended by Daniel Moss
Improve your trading with IG Client Sentiment Data
https://www.dailyfx.com/education/technical-analysis-chart-patterns/bull-flag.html/?ref-author=Moss


