


Linear regression is a common machine learning technique that predicts a real-valued output using a weighted linear combination of one or more input values.
For instance, the sale price of a house can often be estimated using a linear combination of features such as area, number of bedrooms, number of floors, date of construction etc. Mathematically, it can be expressed using the following equation:
house_price = w1 * area + w2 * n_bedrooms + w3 * n_floors + ... + w_n * age_in_years + bThe “learning” part of linear regression is to figure out a set of weights
w1, w2, w3, ... w_n, bthat leads to good predictions. This is done by looking at lots of examples one by one (or in batches) and adjusting the weights slightly each time to make better predictions, using an optimization technique called Gradient Descent.
Let’s create some sample data with one feature
x(e.g. floor area) and one dependent variable
y(e.g. house price). We’ll assume that
yis a linear function of
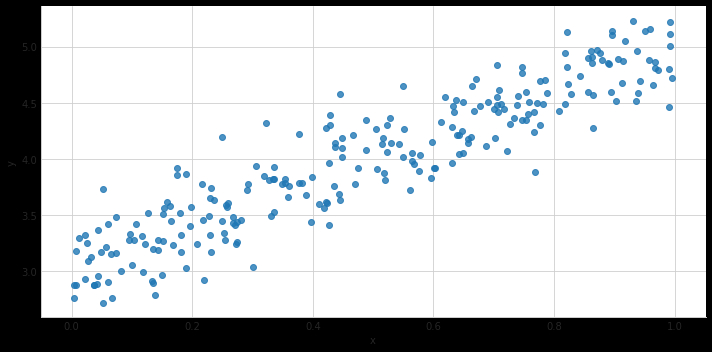
x, with some noise added to account for features we haven’t considered here. Here’s how we generate the data points, or samples:
m, c = 2, 3
noise = np.random.randn(250) / 4
x = np.random.rand(250)
y = x * m + c + noise
And here’s what it looks like visually:
Now we can define and instantiate a linear regression model in PyTorch:
class LinearRegressionModel(nn.Module):
    def __init__(self, input_dim, output_dim):
        super(LinearRegressionModel, self).__init__()
        self.linear = nn.Linear(input_dim, output_dim)

    def forward(self, x):
        out = self.linear(x)
        return outmodel = LinearRegressionModel(1, 1)
criterion = nn.MSELoss()
optimizer = torch.optim.SGD(model.parameters(), lr=0.01)
For the full code, including imports etc. see this link. Here’s how the model weights look like right now:

As you can see, it’s quite far from the desired result. Now we can define a utility function to run a training epoch:
def run_epoch(epoch):
    # Convert from numpy array to torch tensors
    inputs = Variable(torch.from_numpy(x.reshape(-1, 1).astype('float32')))
    labels = Variable(torch.from_numpy(y.reshape(-1, 1).astype('float32')))

    # Clear the gradients w.r.t. parameters
    optimizer.zero_grad()

    # Forward to get the outputs
    outputs = model(inputs)

    # Calcuate loss
    loss = criterion(outputs, labels)

    # Getting gradients from parameters
    loss.backward()

    # Updating parameters
    optimizer.step()

    return loss
Next, we can train the model and update the state of a animated graph at the end of each epoch:
%matplotlib notebook
fig, (ax1) = plt.subplots(1, figsize=(12, 6))
ax1.scatter(x, y, s=8)w1, b1 = get_param_values()
x1 = np.array([0., 1.])
y1 = x1 * w1 + b1
fit, = ax1.plot(x1, y1, 'r', label='Predicted'.format(w1, b1))
ax1.plot(x1, x1 * m + c, 'g', label='Best Fit')
ax1.legend()
ax1.set_xlabel('x')
ax1.set_ylabel('y')
ax1.set_title('Linear Regression')def init():
    ax1.set_ylim(0, 6)
    return fit,def animate(i):
    loss = run_epoch(i)
    [w, b] = model.parameters()
    w1, b1 = w.data[0][0], b.data[0]
    y1 = x1 * w1 + b1
    fit.set_ydata(y1)epochs = np.arange(1, 250)
ani = FuncAnimation(fig, animate, epochs, init_func=init, interval=100, blit=True, repeat=False)
plt.show()
This will result in following animated graph:
That’s it! It takes about 200 epochs for the model to come quite close to the best fit line. The complete code for this post can be found in this Jupyter notebook: https://gist.github.com/aakashns/82db9df1e6c20eb13523903507dbd537
Tags
Create your free account to unlock your custom reading experience.


