Abstract
Chen and Pfennig (Reports, 20 March 2020, p. 1377) analyze the fitness consequences of hybridization in toads but do not account for differences in survival among progeny. Apparent fitness effects depend on families with anomalously low survival, yet survival is crucial to evolutionary fitness. This and other analytical shortcomings demonstrate that a conclusion of adaptive mate choice is not yet justified.
Chen and Pfennig (1) extend the potential impact of hybrid zone studies with a report of adaptive heterospecific mate choice in spadefoot toads, a result with far-reaching implications (2). However, survival is crucial to evolutionary fitness (3), and hybrid vigor, while common, does not always predict fitness. We wondered how consideration of these issues would affect their conclusions.
Central to their claim is an experiment in which 20 female Spea bombifrons were paired with 20 male Spea multiplicata. Survival and growth of up to 50 progeny per pair were monitored for 12 days, when several measures were taken [mass, snout-vent length (SVL), Gosner stage (an ordinal scale of development)]. These measures were highly correlated, so the authors used principal components analysis to derive an overall proxy of tadpole fitness (PC1). They then analyzed several linear models to explore whether variation in this proxy was correlated with parental size, condition, genotype, and sire vocalizations. This analysis resulted in their figure 1, which illustrates their conclusion that tadpole fitness is predicted by father’s call (sire pulse rate).
We noticed that their results might depend on three outlier families at the upper or lower ends of the observed range in sire pulse rate (their figure 1). These three families also had low survival rates (≤30% versus mean of 64% for 17 families with surviving tadpoles) [table “xref-ref-1-2” not found /]
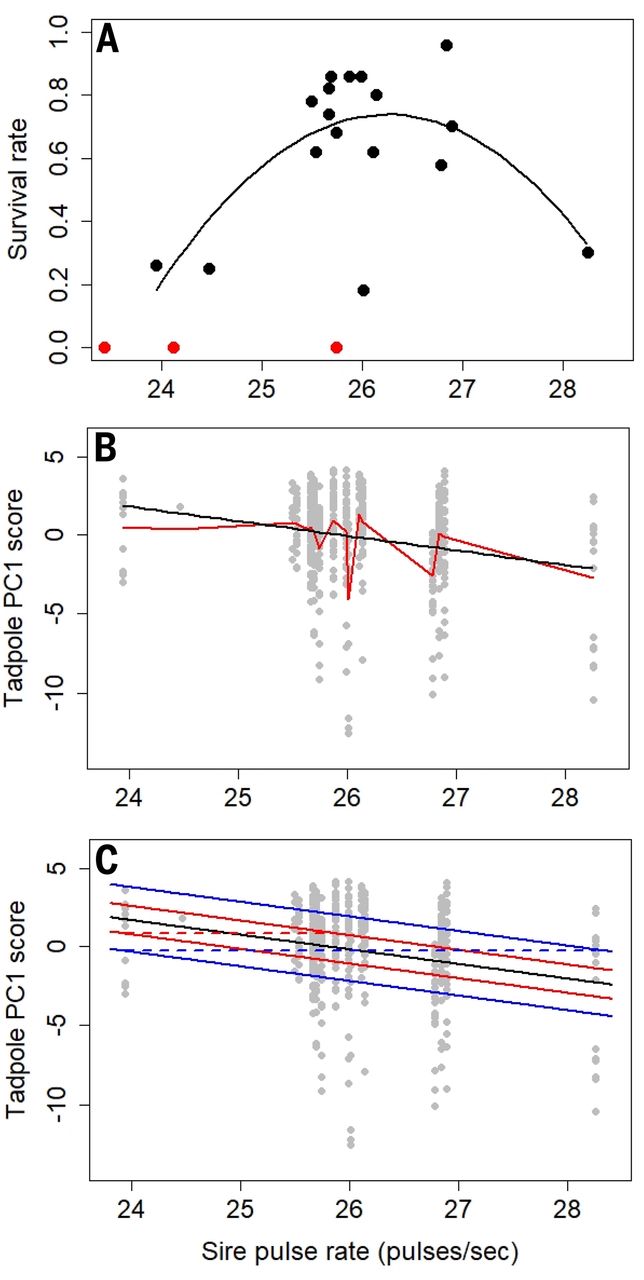
. The authors concluded that “Hybrid tadpole survivorship was not significantly predicted by any parental traits” [supplementary text of (1)], but they only considered linear models. In fact, a nonlinear, unimodal relationship between survival and sire pulse rate better fits the data (Fig. 1A), which suggests that survival should not be ignored. Furthermore, three families with zero survival were excluded (4) and two of these also had low sire pulse rates (Fig. 1A). The distribution of PC1 is surely truncated in families with low survival, but it is difficult to assess the impact of truncation given the experimental design.

(A) Tadpole survival and sire pulse rates for 17 families analyzed by Chen and Pfennig (1) (black dots) and for three families not included in their analyses (red dots) (4). A nonlinear unimodal model (black line) for n = 17 families had P = 0.014 for the joint effect of the linear and quadratic terms. This model fits significantly better (ΔAICc = 6.35) than a linear model (12). AICc is the Akaike information criterion with correction for small sample sizes. (B) Estimated relationship of mean principal component 1 (PC1) scores and sire pulse rate for 17 families (n = 479 tadpoles) from a mixed-effects model with a random effect for family plus a linear fixed effect for sire pulse rate (black line) and for a model using only a random effect for family (red lines), which demonstrates lack of fit of the linear relationship. (C) Quantile splits for the separation of PC1 score distributions for tadpoles illustrate the lack of predictive power of sire pulse rate. The solid black line is the mean regression estimate from the mixed-effects model of Chen and Pfennig, as in (B). The lower and upper red lines are the 0.36 and 0.64 quantiles, respectively, and the lower and upper blue lines are the 0.21 and 0.79 quantiles, respectively, from the normal distribution. These correspond to quantile splits QS(1.93) = 0.36 and QS(4.31) = 0.21, indicating 36% and 21% overlap in PC1 probability distributions, respectively. The horizontal dashed red and blue lines depict separation distances = 1.93 (median – minimum) and 4.31 pulses/s (maximum – minimum), respectively. Quantile splits for the PC1 score distribution at any separation distance are computed as QS(separation distance) = Φ[–|estimated slope for sire pulse rate|×(separation distance)/(2 × estimated standard deviation of regression)], where Φ is the normal distribution function (8, 9). Here, the estimated slope is –0.928 and the estimated standard deviation of the regression is 2.528.
We were also concerned about relying on measures of tadpole growth as the sole fitness metric in a hybrid system. Hybridization is often maladaptive, as it is for female S. multiplicata in this system (2, 5). Heterosis (hybrid vigor) is common but does not always predict reproductive success: Mules are stronger than horses, but their lifetime fitness is zero. Although mass, SVL, and Gosner stage may sometimes be reasonable fitness proxies, these measures could reflect heterotic effects in this hybrid system. Moreover, these measures ignore critical later stages of the life cycle—including metamorphosis, survival, fertility, sex ratio, and mating success—all of which affect how selection operates on adult traits, such as male calling rate and female preference. Complete fitness estimates require following the fate of offspring from zygote until reproduction and ideally until death. These caveats, together with the question of how to deal with survival, led us to examine more closely the evidence that sire pulse rate predicts tadpole fitness.
Because the authors sought to estimate the partial effect of each fixed effect on mean PC1 scores, it was incorrect to model-average regression coefficients (6) without accounting for multicollinearity among the predictors in the standardization (7). In fact, neither is necessary. We explored the partial effects of sire pulse rate by examining estimates across the five models that included this term [table “xref-ref-1-5” not found /]
without standardization or model averaging. The models included random effects for each family and fixed effects for sire pulse rate and other parental predictors, each of which had a single unique value for each family. Thus, their analysis inherently considers parental predictors to enter models both as categorical variables (through random effects on family) and as fixed linear effects.
Comparing a model with only family effects (equivalent to a categorical model for sire pulse rate, conditional R2 = 0.289) to models that included a linear fixed effect for sire pulse rate indicated substantial lack of fit for the linear predictor (Fig. 1B) across the five models (marginal R2 = 0.042 to 0.057). This analysis revealed that there is no consistent decline in mean PC1 scores up to a sire pulse rate of 27; in fact, most of the decline is due to a single family, which also had low survival, with the highest pulse rate. Estimating models excluding this family, we found that regression coefficients for sire pulse rate diminished greatly and were not statistically different from zero (P > 0.05) for three of the five models. The combination of lack of fit of the linear relationship of sire pulse rate, the low proportion of variance attributed to it, and small effect size of sire pulse rate ( = –1.214 to –0.928) relative to the estimated standard deviation ( = 2.526 to 2.529) of the regressions indicates extensive overlap in PC1 distributions with minimal explanatory ability for sire pulse rate (Fig. 1C) (8, 9).
Lastly, using a principal component score to estimate fitness is undesirable because it is a synthetic mathematical construct that lacks straightforward interpretation. In this case, the authors combine two continuous variables (mass, SVL) with an ordinal one (Gosner stage) using covariances that fail to account for scale differences. A more direct, easily interpreted measure of tadpole condition is to estimate mass (M) as an allometric function of size (SVL); that is, M = β0SVLβ1 (10, 11). We estimated this model for median mass at SVL with separate intercepts and exponents for each of 16 families using quantile regression (Fig. 2A) (10). We did not include Gosner stage as a predictor, because it had a weak effect (P = 0.079) and only reduced the coefficient of determination by 0.002. Estimated median mass at SVL = 14 mm with 95% confidence intervals for each family reveals considerable overlap and no distinct pattern when plotted against sire pulse rate (Fig. 2B) or tadpole survival (Fig. 2C); these findings indicate that tadpole condition was not related to either variable (also true for female SVL, not shown).

(A) Allometric relationships of tadpole mass (g) and snout-vent length (SVL, mm) for 16 families of tadpoles from Chen and Pfennig (1). Family 15 with a single surviving tadpole was excluded from this analysis. This model indicates higher condition for tadpoles with greater mass at a common SVL achieved during the 12-day time interval. Estimated median regression relationships for the families with lowest (red) and highest (blue) sire pulse rates from the quantile regression model allow separate intercepts and slopes for each family, p = 32 parameters and n = 478. The allometric relationship was estimated in a linear model as log(M) = log(β0) + β1 log(SVL) and back-transformed to the multiplicative form. Here, we used log10 and included indicator variables for 16 families and their interaction with SVL. The coefficient of determination for this model is 0.691 in absolute deviations (P < 0.001), which is equivalent to 0.905 = 1.0 – (1.0 – 0.691)2 in squared deviations similar to R2. (B) Median mass at SVL = 14 mm and 95% confidence intervals (bootstrapped) estimated for each of the 16 families and graphed with respect to their corresponding sire pulse rates. Similar patterns were obtained for SVL = 12 and 16 mm, not shown. (C) Same as (B) but now plotted against tadpole survival.
We conclude that the authors’ claim of adaptive heterospecific mate choice is not well supported by their analyses or available data, but we encourage them to continue their insightful work on this remarkable system.
References and Notes
- ↵
- ↵
- ↵
- ↵Data on these three families were provided by the authors (C. Chen and K. S. Pfennig). One of these families produced no eggs; the other two produced eggs, but embryos failed to develop beyond the hatching stage.
- ↵
- ↵
- ↵
- ↵
- ↵
- ↵
- ↵
- ↵R scripts for all modeling in this Comment are deposited in the DRUM archive at the University of Maryland with the following identifier: http://hdl.handle.net/1903/26347.
Acknowledgments: R. C. Bell and P. M. Dixon provided helpful comments on an earlier draft of this work.


