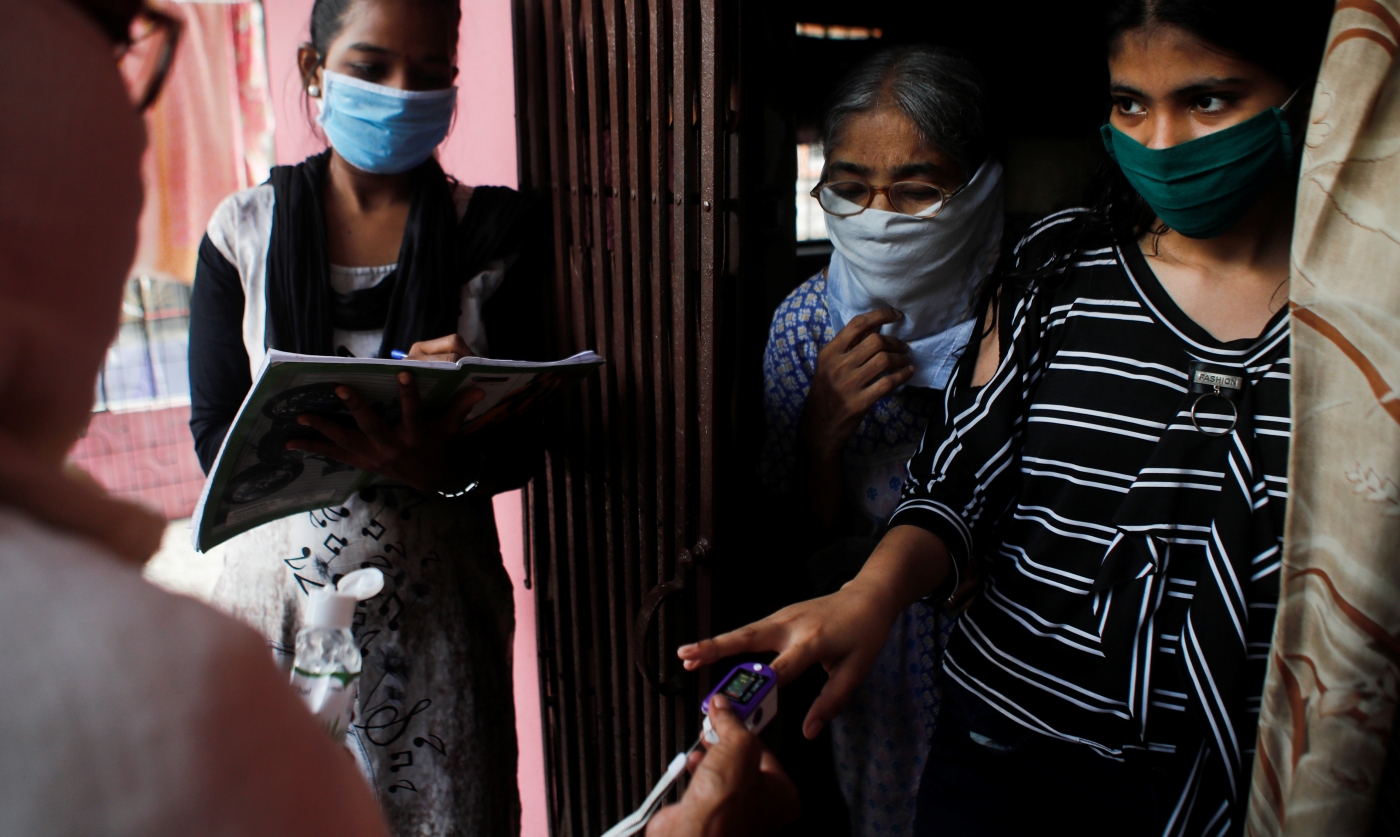
Community health volunteers check the pulse of a resident during a check-up campaign for COVID-19 in Mumbai, September 30, 2020. Photo: Reuters/Francis Mascarenhas/Files.
It was not completely unexpected – but when the findings of the third seroprevalence survey in Delhi and the second in Mumbai were released, most people reacted with a mix of shock and surprise.
The findings of three seroprevalence surveys were released in the last one week. First: on September 29, the Indian Council of Medical Research reported the results of its second nationwide survey. This survey followed its predecessor after nearly two months, and concluded that seroprevalence in the districts it surveyed had shot up from 0.71% to nearly 7.1% in the adult population.
It also said that the probability of testing positive for COVID-19 in urban settings and urban slums was two-times and four-times higher than in rural settings. The number of undetected infections for every COVID-19 case – i.e. the infection to case ratio – dropped from nearly 81-130 to around 26-32.
In all, the survey confirmed that herd immunity without a vaccine remains an infeasible goal and that we need to continue to follow masking, and physical distancing in public places, and personal hygiene protocols. It’s safe to say that the people were slightly disappointed, perhaps, but not surprised.
A day later, the release of the results of Delhi’s third seroprevalence survey prompted widespread surprise. The estimated seroprevalence – i.e. presence of antibodies against COVID-19 in the population – in Delhi was 25% over a month and a half ago, against the 29% being reported, even though the city had reported many more cases in the same period.
The surprise arose from the results having been so different from people’s expectations, and because they had hoped that the city was approaching herd immunity. Indeed, we’re almost certain we’re unlikely to achieve herd immunity without a vaccine.
And a few days later, the Brihanmumbai Municipal Corporation reported the results of the city’s second seroprevalence survey. In Mumbai, like in Delhi, the seroprevalence had reportedly fallen from 57% to 45% in slums, but increased from 16% to 18% in non-slum areas, vis-à-vis the previous survey.
But irrespective of the extent to which these figures and trends are surprising, they are actually in-line with epidemiological wisdom, and the methods that seroprevalence surveys employ.
An epidemiological study’s findings depend on the sample size and how those samples are collected (as this author has previously explained). The more the same samples collected and analysed from more units during a survey, the higher the seroprevalence is likely to be. The number of samples determines, together with other factors, the confidence interval of the findings.
In this case, for example, all three agencies and governments should have presented the data fit to a 95% confidence interval. This is the range across which a value can vary, such that one can be 95% sure that the actual value will be in this range. And the better the sampling methods and sample size, the narrower this range is.
In Delhi’s third seroprevalence survey, the surveyors changed the sampling units from 11 districts (as in the previous survey) to 272 wards. The survey also stratified the samples collected by type of accommodation – resettlement colonies, urban slums, planned colonies, unauthorised colonies, etc. However, since the total sample size was similar in both surveys but the number of units surveyed had increased nearly 25x, the average number of samples per unit dropped. And statistically, these findings are likely to be closer to the truth – i.e. the third survey presents a truer picture of reality.
This doesn’t mean the first two surveys were wrong – only that researchers are continuously improving their methods based on more information we’re getting about the pandemic. This said, it’s notable that the results of the first two surveys were comparable, because they employed similar methods. The third one breaks away from this pattern, and so isn’t directly comparable.
Next, let’s consider Mumbai, specifically how its seroprevalence seems to have fallen in the second survey, relative to the first. Most media reports of the first seroprevalence survey results were concerned with the single-point prevalence. However, two other numbers are relevant here to fully understand the results: the confidence interval and the statistical significance, also denoted by a number called a p-value.
We just discussed the 95% confidence interval; it’s a common way to communicate measurements in various scientific fields. The single-point prevalence stands for a single value in the 95% interval.
Second, following the application of statistical tools, if the p-value of a measurement is lower than 0.05, then the measurement can be considered to be different – not occurring in the natural course of things.
Now, if the single-point prevalences of two surveys are different, but their 95% confidence intervals overlap, the findings are not statistically significant – and the difference in prevalence is likely a result of how the sampling was done.
For example, in Mumbai’s non-slum areas, the single-point prevalences were 16% and 18%. Let’s assume each of these values had a narrow 95% confidence interval of plus-or-minus 1.5% – i.e. for the first survey, the range would be 14.5-17.5%, and for the second, 16.5-19.5%. These two ranges overlap (16.5-17.5%). So scientifically speaking, one can’t say the 18% figure is higher than the 16% – i.e. scientifically speaking, the seroprevalence hasn’t increased.
Similarly, the seroprevalence in Mumbai’s slum areas dropped from 57% to 46% between the two surveys. But without knowing the 95% confidence intervals for both figures, it’s impossible to say if the decrease is statistically significant.
This is why the states and cities releasing the results of their surveys can do better if they report the data along with the proper confidence intervals.
All this said, one thing is clear: the ways in which researchers are approaching seroprevalence surveys are only getting more robust, and it’s heartening that the government is actively considering this data.
According to ICMR’s second survey, the national seroprevalence is around 7% (notwithstanding any caveats and shortcomings). So we are quite far from achieving herd immunity. In addition, a higher seroprevalence in one area doesn’t mean that the area is closer to herd immunity if its neighbourhoods have a lower seroprevalence. Herd immunity enters the picture if the seroprevalence is uniformly high everywhere.
In any case, it is more reasonable to assume that as far as India’s COVID-19 epidemic is concerned, we will be better off following the face-masking, distancing and hand-hygiene protocols.
Dr Chandrakant Lahariya is an epidemiologist and public health specialist. He tweets at @DrLahariya. The views expressed here are the author’s own.


