
- NZD/USD hourly chart shows a bearish divergence of key indicators.
- A violation of support at 0.6715 could invite stronger selling pressure.
NZD/USD is trading near 0.6732 at press time, representing a 0.11% decline on the day. The pair reached a high of 0.6752 during the early Asian session. That level was last seen on Dec. 31, 2019.
The pullback from 0.6752 has confirmed a bearish divergence of the relative strength index on the hourly chart. Similarly, the slow stochastic indicator has also diverged in favor of the bears.
As such, the former resistance-turned-support at 0.6715 (July 31 high) could be put to the test soon. Acceptance under that level would shift the focus to the ascending 5-day simple moving average (SMA), currently at 0.6655.
The overall trend would remain bullish while the pair is held above the daily chart higher low of 0.6489 created on Aug. 20.
Hourly chart
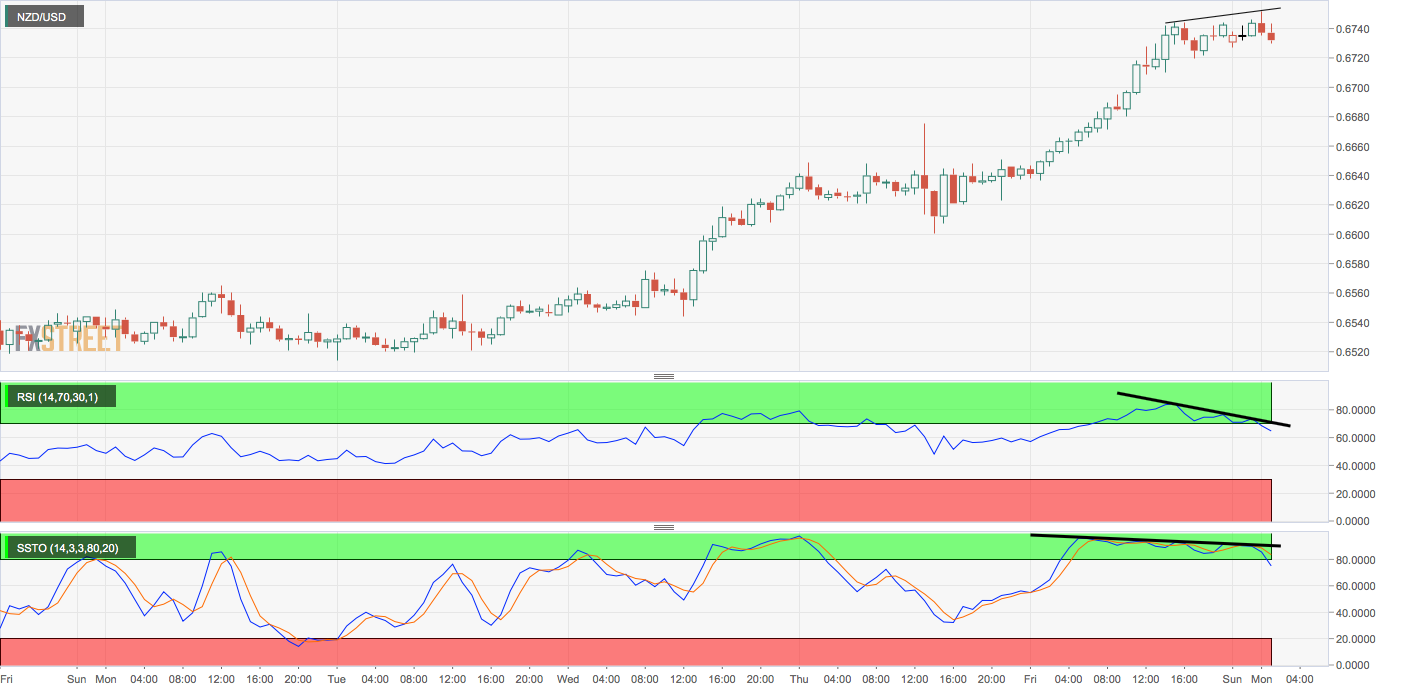
Trend: Pullback likely
Technical levels


