We analyzed study 2 data using PROCESS (42), controlling for managers’ differing characteristics. Experimental condition (target gender; X) was coded 0 (female/“Elizabeth”) and 1 (male/“Mark”), and managers’ beliefs about ongoing gender discrimination in their field (M) were examined at ±1 SD (mean-centered; so to examine θX➔Y | M). The distribution of these beliefs yielded values at ±1 SD of approximately 2.55/5.59 (M = 4.07; 1 to 7 scale; for descriptive clarity, values here are not mean-centered). This corresponded to a general rejection versus endorsement of the idea that women in their profession no longer face discrimination. Thus, these values are meaningful not only because they reflect true values in the population but also because they represent categorically distinct beliefs about the existence of gender discrimination in the field.
Prevalence of beliefs about gender bias in the profession. Initial descriptive analyses revealed that a plurality of managers believed that gender discrimination was no longer an issue in their profession [scoring above the scale’s midpoint (neither agree nor disagree)]. Specifically, 44.5% of managers believed this, of whom 61.1% were men. Another 40.6% of managers rejected this belief (scoring below the midpoint), of whom 23.3% were men. Another 15.0% were neutral/uncertain (scoring at the midpoint), of whom 42.1% were men. Further analyses showed that while both men and women endorsed this belief (and rejected it), men were significantly more likely to endorse it (and women more likely to reject it), χ2 (1) = 31.34, P < 0.001. Similarly, examining endorsement on a continuum (versus categorically) showed that men’s endorsement of this belief (M = 4.75, SD = 1.33) was significantly greater than women’s (M = 3.56, SD = 1.45), t252 = 6.72, P < 0.001, d = 0.85.
Note that in analyses testing whether male versus female managers differed in their tendency to show biased evaluations of the target vet (testing managers’ gender as a moderator; analyses otherwise paralleled primary analyses described below), we found no evidence of differences between male and female managers (for more details, see the “Study 2 supplemental analyses” section in the Supplementary Materials). Rather, as described below, managers’ biased evaluations of the target vet were squarely rooted in their belief that women in the profession no longer face discrimination.
Evaluations of competence. Paralleling previous work (5), the performance review was designed to create ambiguity about the target employee’s competence, and so, primary analyses tested whether managers’ competence evaluations differed as a function of the target’s purported gender and whether such a difference was evident squarely among those who believe gender bias is no longer an issue in the profession. Predictions were tested in PROCESS model 1 with 5000 resamples (95% confidence intervals in brackets).
Analyses of the first competence indicator (overall competence) evinced differences in the perceived competence of the male versus female employee but only among those who believed gender bias was no longer an issue: condition*bias-belief, B = 0.20 [0.05, 0.35], SE = 0.08, P = 0.01, ΔR2 = 0.03 (F1,227 = 6.58), f 2 = 0.03 (main effects: condition, B = 0.17 [−0.06, 0.41], SE = 0.12, P = 0.14; bias-belief, B = −0.08 [−0.16, 0.00], SE = 0.04, P = 0.06). Managers who rejected this belief did not differ in their competence evaluations of the male and female target employee (θX➔Y = −0.13 [−0.46, 0.20], SE = 0.17, P = 0.44). By comparison, managers who endorsed it—those who believed women in their profession no longer experience bias—demonstrated a systematic bias, evaluating the male employee as significantly more competent than the otherwise identical female employee (θX➔Y = 0.48 [0.15, 0.80], SE = 0.17, P = 0.004; Fig. 2).

Scale is 1 to 7 (n = 236); higher values indicate higher competence evaluations. Among managers who believe discrimination against women is no longer an issue, the male employee was evaluated as more competent than the otherwise identical female employee. Analyses probed the interaction (by managers’ beliefs) at ±1 SD. These values correspond to a general endorsement/rejection of these beliefs. For ease of interpretation and because the values represent categorically distinct beliefs, they are presented as bars (estimated means at ±1 SD with covariates at their sample means). The differences in means correspond to the following values: “Holding the Belief that Women in the Profession Do Still Face Discrimination,” θX➔Y = −0.13, SE = 0.17, P = 0.44 [−0.46, 0.20]; “Holding the Belief that Women in the Profession Do NOT Face Discrimination,” θX➔Y = 0.48, SE = 0.17, P = 0.004 [0.15, 0.80]. For an analogous depiction with the above confidence intervals (around the conditional effect of target gender, θX➔Y | M), see fig. S2.
As another indicator of the perceived competence and worth of this employee, managers indicated the extent to which they anticipated this employee was valued, admired, and looked up to among colleagues (paralleling the measure of perceived value/worth among colleagues from study 1). Mirroring the effect described above, results evinced differences in how the male versus female employee was evaluated, specifically among managers who believed gender bias was no longer an issue: condition*bias-belief, B = 0.27 [0.11, 0.44], SE = 0.08, P = 0.001, ΔR2 = 0.04 (F1,236 = 10.84), f 2 = 0.05 (main effects: condition, B = 0.09 [−0.16, 0.34], SE = 0.13, P = 0.47; bias-belief, B = 0.02 [−0.07, 0.11], SE = 0.05, P = 0.62). Again, while those who rejected this belief did not differ in their evaluations of the male and female target (θX➔Y = −0.33 [−0.68, 0.03], SE = 0.18, P = 0.07), managers who believed gender bias is no longer a problem evaluated the male employee as having greater value and worth than the otherwise identical female employee (θX➔Y = 0.51 [0.16, 0.86], SE = 0.18, P = 0.005).
As a monetary indicator of perceived competence and worth (paralleling previous work) (5), managers indicated the salary they would advise for this employee if s/he was in their own practice. Managers also reported the typical salary for employees in their practice with similar levels of experience as the target, and this was subtracted from the advised salary. Thus, analyses accounted for differences in base salary rates by examining respondent-specific deviations in advised salary (the same pattern of results emerged when analyzing raw advised salaries with typical salary used as a covariate; see the “Study 2 supplemental analyses” section in the Supplementary Materials). Mirroring the effects described above, results evinced bias in advised salaries, specifically among managers who believed gender bias was no longer an issue: condition*bias-belief, B = £934.98 [£183.01, £1686.95], SE = £381.55, P = 0.02, ΔR2 = 0.03 (F1,220 = 6.00), f 2 = 0.03 (main effects: condition, B = £1130.58 [−£19.61, £2280.77], SE = £583.61, P = 0.05; bias-belief, B = £56.89 [−£357.81, £471.58], SE = £210.42, P = 0.79). Thus, while those who rejected this belief did not differ in advised salaries (θX➔Y = −£303.07 [−£1942.79, £1336.65], SE = £832.00, P = 0.72), managers who endorsed it advised paying the male employee ~£2564 or $3475 more than the otherwise identical female employee (θX➔Y = £2564.23 [£946.78, £4181.69], SE = £820.71, P = 0.002; Fig. 3). This equated to a gender pay gap of approximately 8% or, more formally, unequal pay of 8% (for equally qualified workers). As a more direct translation, this equated to paying the male employee ~$1.75 more than the female employee every hour for the next 2000 consecutive hours or one full year of work. A second measure of perceived financial worth (willingness to offer the employee a raise) showed the same pattern of results: condition*bias-belief, B = 0.35 [0.07, 0.63], SE = 0.14, P = 0.01, ΔR2 = 0.02 (F1,235 = 6.02), f 2 = 0.02 (main effects: condition, B = −0.02 [−0.45, 0.41], SE = 0.22, P = 0.93; bias-belief, B = −0.12 [−0.27, 0.04], SE = 0.08, P = 0.13), although the difference in offered pay raise by target gender was not significant among those who rejected (θX➔Y = −0.55 [−1.16, 0.06], SE = 0.31, P = 0.08) or endorsed (θX➔Y = 0.52 [−0.09, 1.12], SE = 0.31, P = 0.09) beliefs about women still facing bias in the field.

To account for individual differences in base salary rates, managers reported the typical salary in their practice for employees with similar experience as the target, and this was subtracted from the advised salary; thus, any differences in base salary rates (can be substantial across different regions of the country) were accounted for by analyzing respondent-specific deviations in advised salary. Y-axis values therefore represent deviations in advised salary (from individually adjusted base salary). A value of £0 indicates that managers advised paying the target employee the same as others in their practice with comparable experience. Among managers who believe discrimination against women is no longer an issue, they advised that the male employee receive a higher salary than the otherwise identical female employee. Analyses probed the interaction (by managers’ beliefs) at ±1 SD. These values correspond to a general endorsement/rejection of these beliefs. For ease of interpretation and because the values represent categorically distinct beliefs, they are presented as bars (estimated means at ±1 SD with covariates at their sample means). The differences in means correspond to the following values: “Holding the Belief that Women in the Profession Do Still Face Discrimination,” θX➔Y = −£303.07, SE = £832.00, P = 0.72 [−£1942.79, £1336.65]; “Holding the Belief that Women in the Profession Do NOT Face Discrimination,” θX➔Y = £2564.23, SE = £820.71, P = 0.002 [£946.78, £4181.69]. For an analogous depiction with the above confidence intervals (around the conditional effect of target gender, θX➔Y | M), see fig. S3.
Last, to produce a more robust indicator of competence and worth, as in previous work (5), the four aforementioned competence indicators were standardized and averaged to form a composite. Consistent with results for each individual measure, this composite measure evinced differences in competence evaluations among those who believed gender discrimination was no longer an issue: condition*bias-belief, B = 0.22 [0.11, 0.33], SE = 0.06, P < 0.001, ΔR2 = 0.06 (F1,213 = 15.10), f 2 = 0.07 (main effects: condition, B = 0.12 [−0.05, 0.30], SE = 0.09, P = 0.16; bias-belief, B = −0.04 [−0.10, 0.03], SE = 0.03, P = 0.27). Again, while those who rejected this belief did not differ in their evaluations of the male and female employee (θX➔Y = −0.22 [−0.47, 0.03], SE = 0.13, P = 0.08), managers who endorsed it evaluated the male employee as more competent than the otherwise identical female employee (θX➔Y = 0.47 [0.22, 0.71], SE = 0.12, P < 0.001).
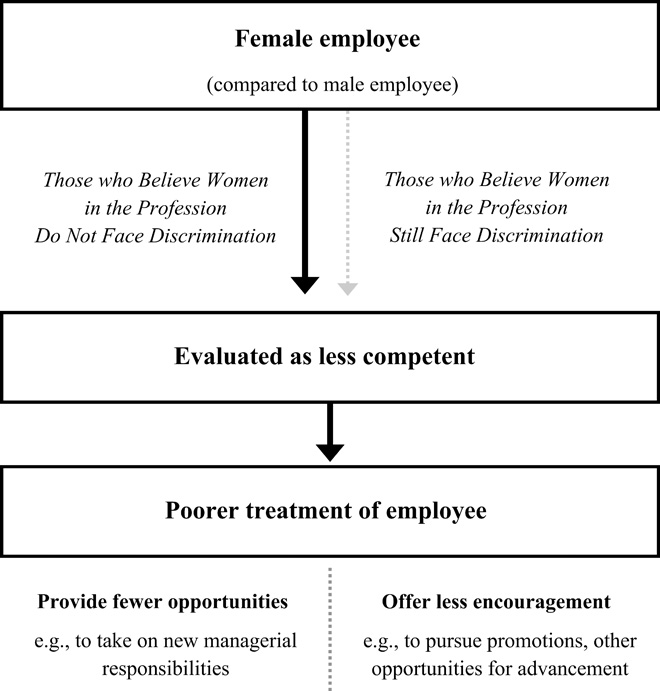
Competence evaluations predict treatment of the employee. With evidence that managers’ own beliefs about extant gender biases undergird their likelihood of expressing gender-biased evaluations, further analyses tested whether managers’ biased competence evaluations translated into biased treatment of the employee (if s/he was in their own practice; e.g., whether they would let her/him take on more supervisory responsibilities). Specifically, moderated mediation (model 7, using competence composite measure) tested for an indirect effect of employee gender on managers’ intended treatment of the employee, via perceived competence—an effect expected to be evident among those who thought gender discrimination was no longer an issue in their field.
Results demonstrated just that. While managers’ competence evaluations were critical to predicting how they would treat the employee overall (B = 0.77 [0.56, 0.98], SE = 0.11, P < 0.001), these competence evaluations were themselves systematically biased among those who thought gender bias was no longer an issue (condition*bias-belief, B = 0.22 [0.11, 0.33], SE = 0.06, P < 0.001), which translated into biased treatment. In other words, there was a significant indirect effect of target gender on treatment (direct effect: B = −0.17 [−0.45, 0.11], SE = 0.14, P = 0.24) but only among those who believed gender bias was no longer an issue: indirect effect = 0.36 [0.16, 0.62]. Among those who rejected this belief, the employee’s gender had no significant bearing on how s/he would be treated (indirect effect = −0.17 [−0.38, 0.01]; Fig. 4).

Managers’ competence evaluations were key to predicting how they would treat the employee {e.g., willingness to let her/him take on more supervisory responsibilities and be more involved in managing the business/financial side of the practice (if s/he was in their practice); B = 0.77 [0.56, 0.98], SE = 0.11, P < 0.001}. However, these competence evaluations were themselves systematically biased among those who thought gender bias was no longer an issue (condition*bias-belief, B = 0.22 [0.11, 0.33], SE = 0.06, P < 0.001), which translated into differential, discriminatory treatment. In other words, there was a significant indirect effect of target gender on treatment but only among those who believed that gender bias was no longer an issue: indirect effect = 0.36 [0.16, 0.62]. Among managers who rejected this belief, the employee’s gender had no bearing on how s/he would be treated (indirect effect = −0.17 [−0.38, 0.01]).
As a second indicator of how managers would treat this employee, they were asked to indicate what advice they would give if the employee expressed interest in pursuing a key promotion in the near future. Specifically, they were asked how readily they would encourage her/him to seek this promotion (to the position of principal vet; response options ranged from advising s/he pursue the position within the next year, to advising that s/he would not be ready to take on this position anytime in the next 6 years). Results mirrored those described above. The employee’s gender had a significant indirect effect (direct effect: B = −0.20 [−0.49, 0.08], SE= 0.14, P = 0.16) on the advice managers would give, favoring the male employee, but only among those who believed gender bias was no longer an issue: indirect effect = 0.27 [0.10, 0.49]. Among managers who rejected this belief, the employee’s gender had no significant bearing on the advice s/he would be given (indirect effect = −0.13 [−0.30, 0.00]).


