
South African Rand is again drawing bids and pushing the USD/ZAR pair lower. The currency pair is currently trading near 17.30 – the lowest level since March 27 and reporting a month-to-date loss of 6.57%. On a week-to-date basis, the pair is down by over 1.5%.
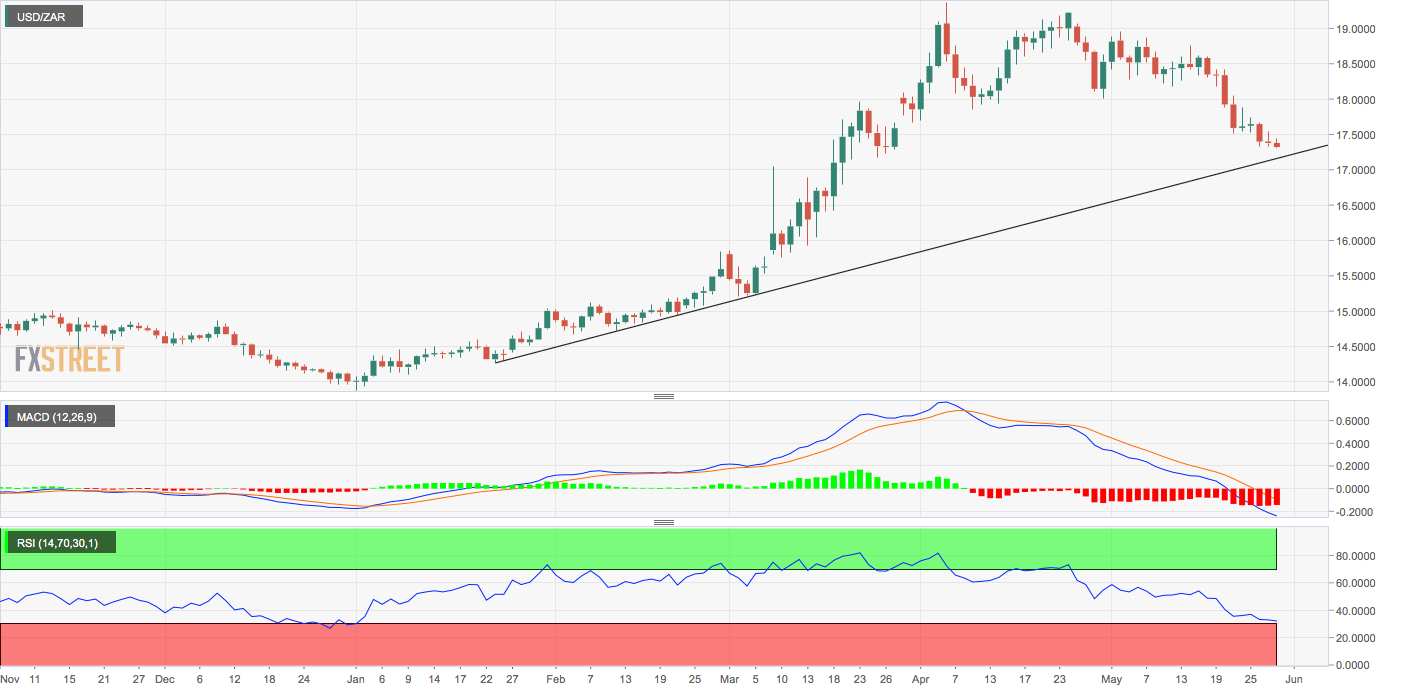
The daily chart MACD histogram is printing deeper bars, confirming the bearish trend. The relative strength index (RSI), too, is reporting bearish conditions with a below-30 print. As a result, a deeper drop to the support of the trendline rising from Jan. 23 and March 4 lows cannot be ruled out. At press time, that trendline support is located at 17.24.
Acceptance under the trendline could invite stronger chart-driven selling, possibly leading to a decline to the 100-day simple moving average (SMA) of 16.715.
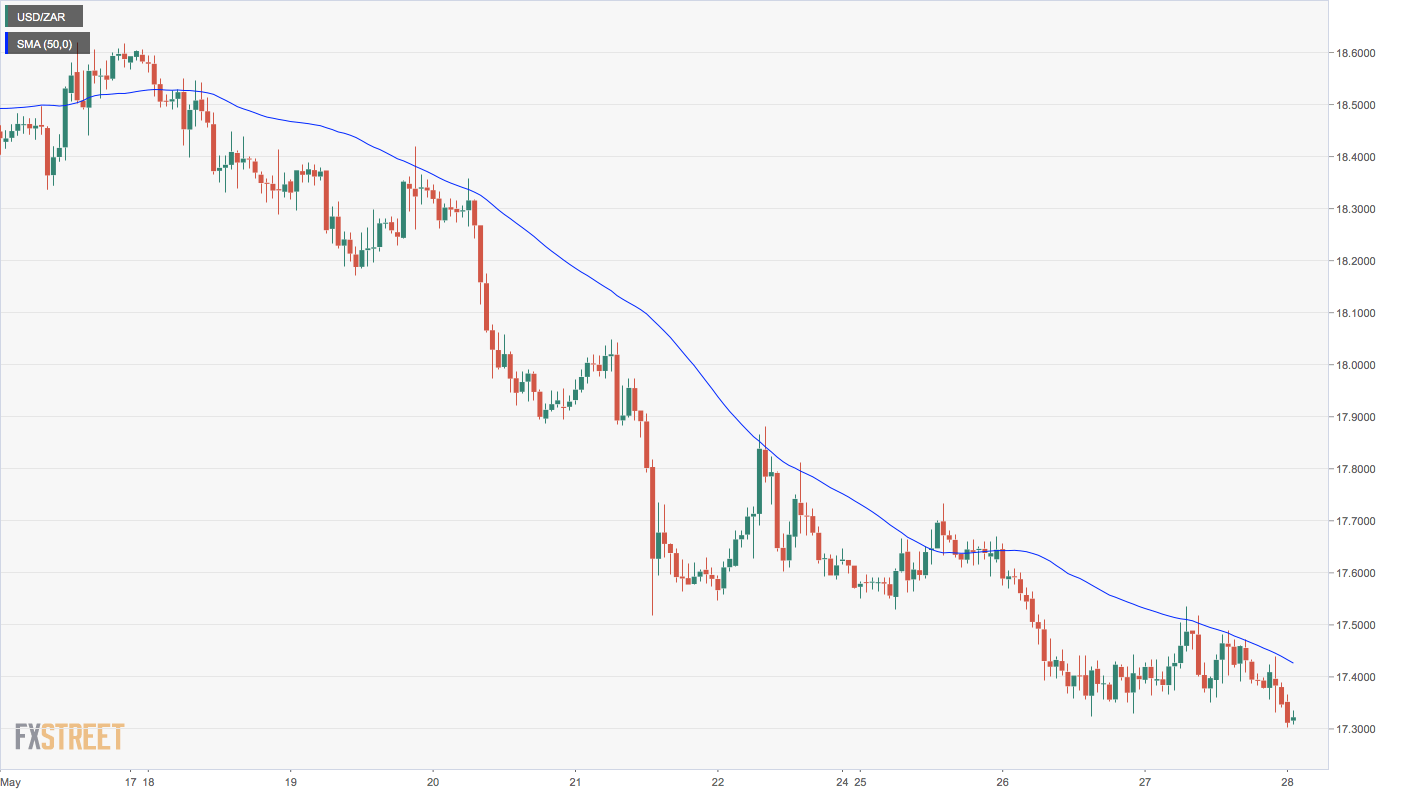
The immediate bearish view would be invalidated if and when the pair establishes a strong foothold above the descending or bearish 50-hour SMA. The pair has charted multiple lower highs along that SMA over the last one week. The 50-hour SMA is currently stationed at 17.4259.
Daily chart
Hourly chart
Trend: Bearish
Technical levels


