
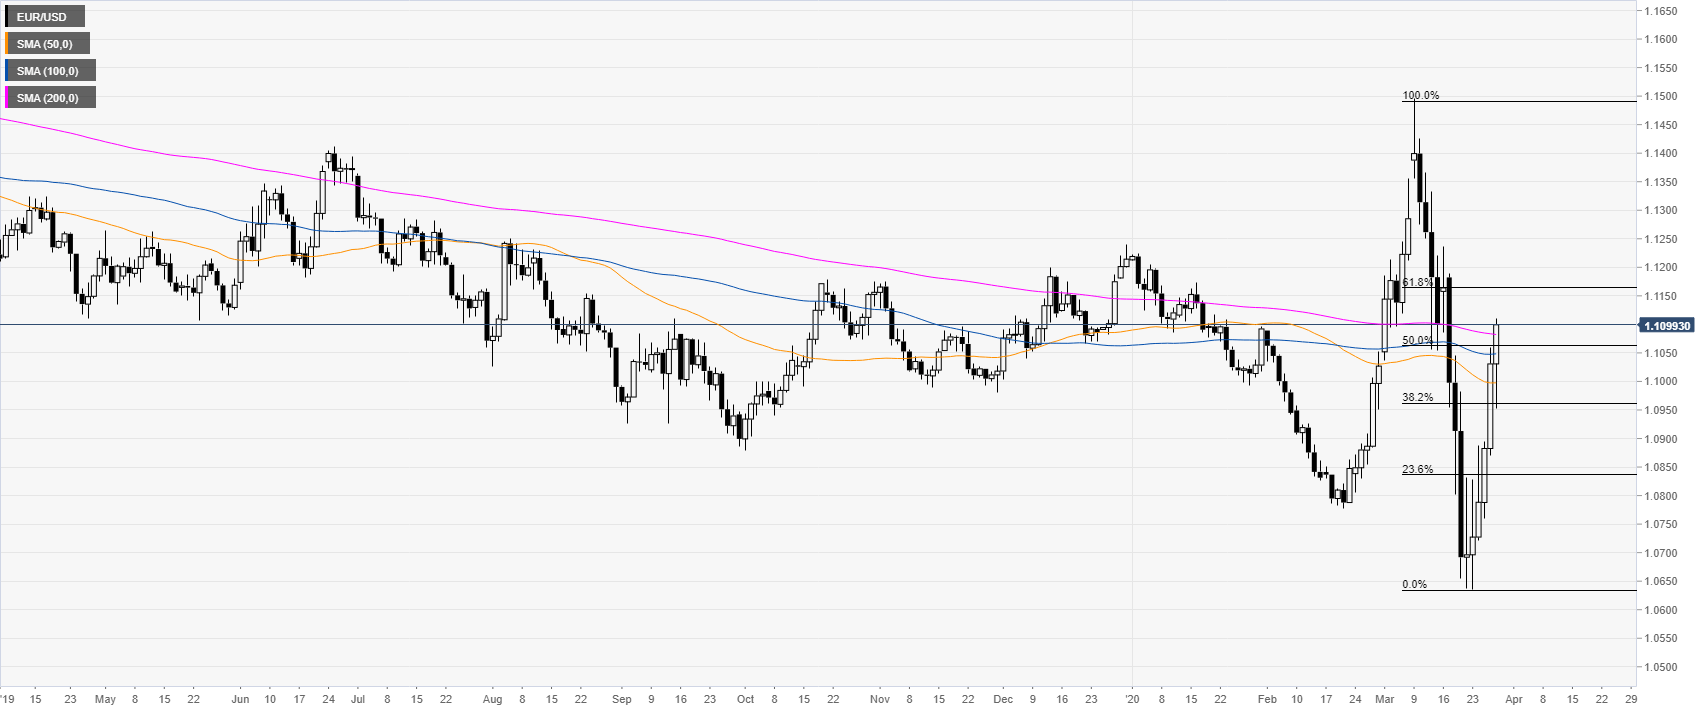
- EUR/USD retracement up challenges the 1.1106 resistance and the 200 SMA on the daily chart.
- The next levels of resistance are seen near 1.1163 and 1.1240.
EUR/USD daily chart
EUR/USD is bouncing sharply from the 2020 lows as the spot is on track to have a daily close above the 1.1100 figure and the 200 DMA (daily simple moving average). The market retraced up more than 50% of its last decline.
EUR/USD four-hour chart
The bullish pressure remains unabated into the end of the week. The spot is looking to break above the 1.1106 resistance en route towards 1.1163 and potentially 1.1240 if the market gathers enough steam. Support is seen near the 1.1065, 1.1014 and 1.0968 price levels, according to the Technical Confluences Indicator.
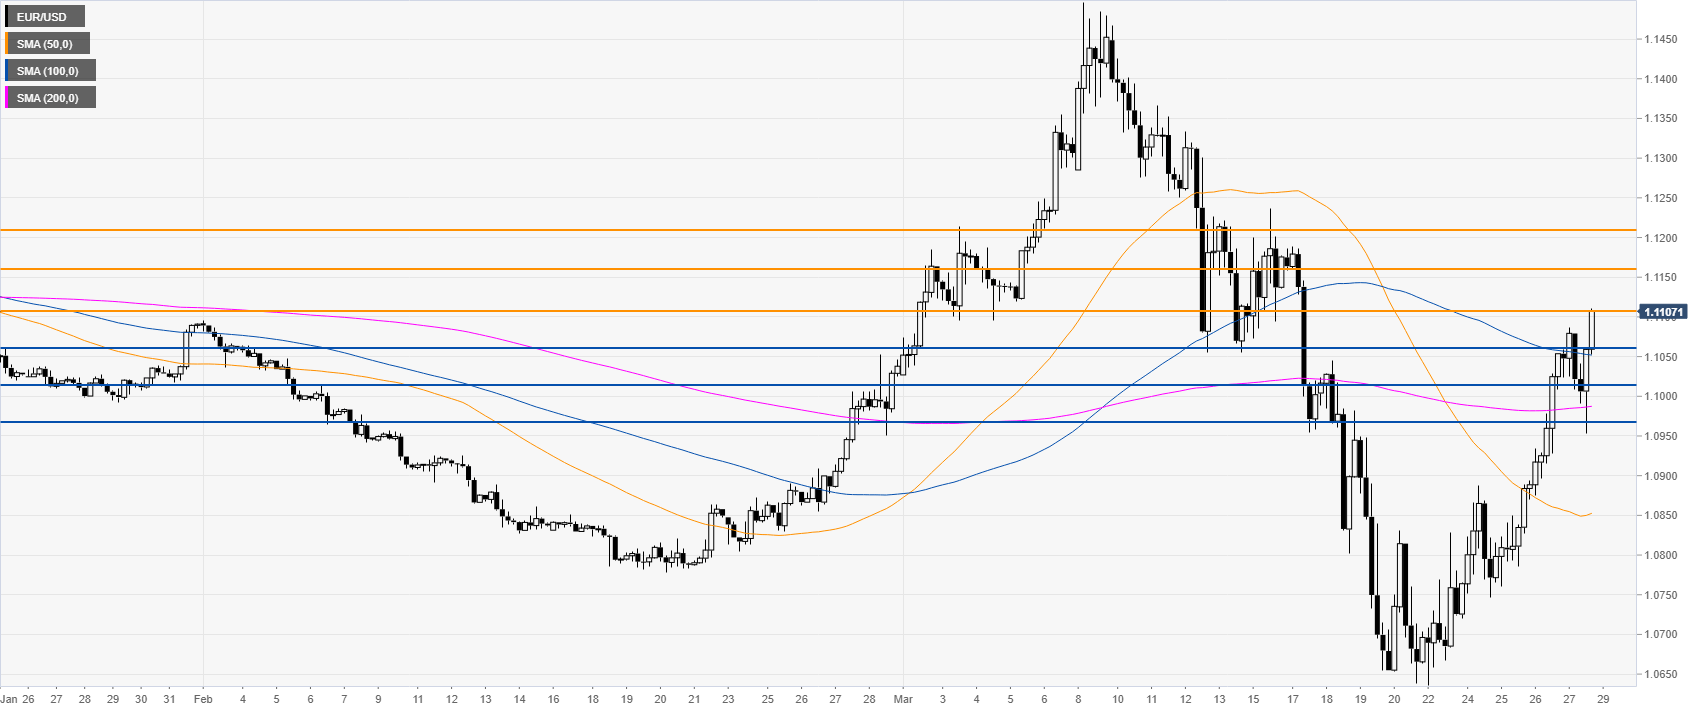
Resistance: 1.1106, 1.1163, 1.1240
Support: 1.1065, 1.1014, 1.0968
Additional key levels


