
XLM Price Analysis – March 25
After the coin has maintained a serious upward movement in the past few days, the bulls suffered a slight downtrend today as the price plans to cross below the moving average.
XLM/USD Market
Key Levels:
Resistance levels: $0.048, $0.050, $0.052
Support levels: $0.032, $0.030, $0.028
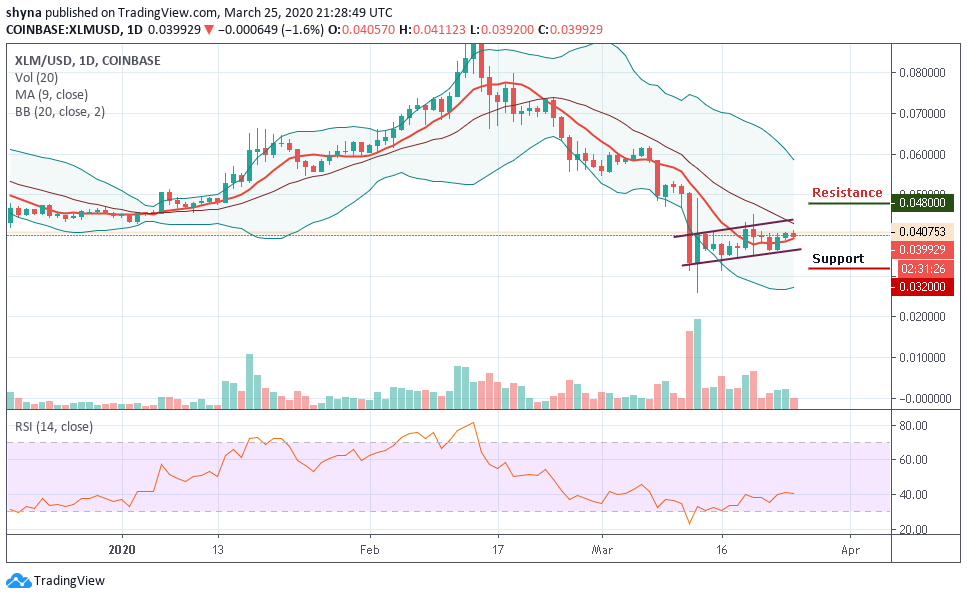
Today, the XLM coin opened at $0.040, and after a mild low swing, it reached $0.041. Facing a rejection above, Stellar pulled back and tried to strike a rebound. XLM/USD has resumed the fall today also and has recently bottomed at $0.039. The crypto coin is hustling to start a robust price recovery, but, it seems, it is still facing hurdles.
Looking at the daily chart, Stellar is currently trading in a red candle and about to cross below the 9-day moving average, with a potential surge of volatility. Considering a northward movement, the amounts of $0.048, $0.050 and $0.052 could constitute resistance for the market. Alternatively, a movement toward the south could bring support down to $0.032, $0.030, and $0.028, while the RSI (14) is moving around the 41-level.
XLM/BTC Market
Against Bitcoin, the pair is seen breaking solid support at the 601 SAT below the 9-day moving average around the middle boundary of the Bollinger bands. Stellar price may likely see another sharp drop at 590 SAT support level if the bulls fail to hold the price. Breaking this level could further drag the market to the nearest support levels at 550 SAT and below.
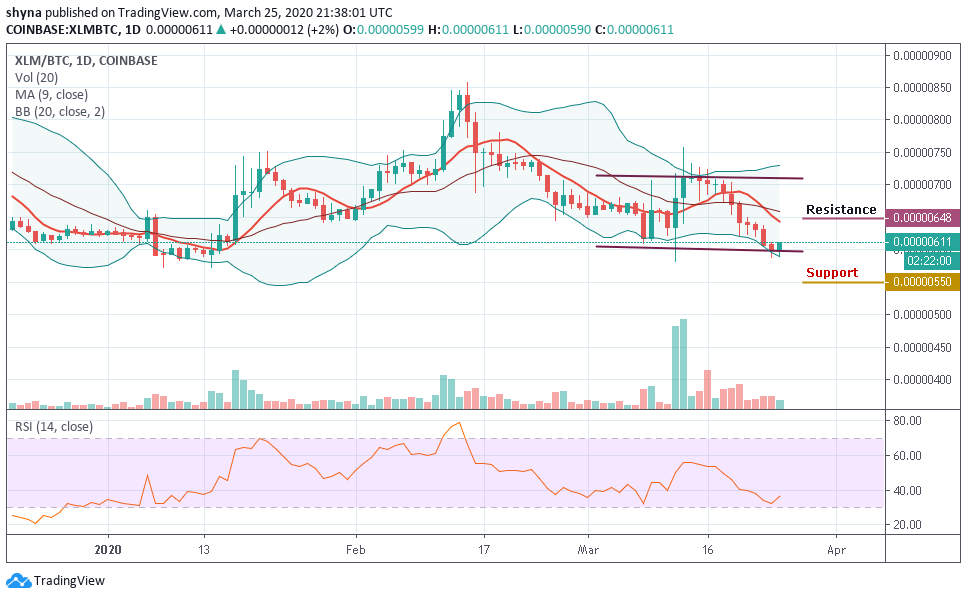
More so, Stellar (XLM) is currently hovering at 11 SAT, if the bulls can hold the price and push it up above the moving average within the channel, the next key targets resistance lies at 648 SAT and above. Meanwhile, RSI (14) moves above 32-level, indicating an upward movement.
Please note: Cryptovibes.com is not a financial advisor. Do your research before investing your funds in any financial asset or presented product or event. We are not responsible for your investing results.


