
Note: This report was originally published on March 4th on Value Investor’s Edge, a Seeking Alpha subscription service.
Overview
After about 20 years of participation I have gone from the reactionary trader, who would have been trying to make sense of daily soundbites and form a coherent thesis in times like this, to the serene investor that accepts what they do not know and instead allows for a sort of fill in the blank scenario as reliable data becomes public.
This patience and acceptance of the unknown, ironically enough, grants a great deal of clarity. While we do not know some things at this point, we can be certain of others. With that certainty comes actionable knowledge.
In several VIE exclusive reports since the end of January, I have made no secret about my aversion to this market in the short run (my trades and short-term moves were tossed aside but my buy and hold forever portfolio has been collecting some bargains).
But as almost two months have passed since the initial outbreak the disconnects are becoming glaring obvious, to the point of where even I (a conservative investor by shipping’s standards) am taking notice.
One of these disconnects is in the product tanker market where rates for MRs have held up exceptionally well yet stocks have plummeted.
Companies engaged in the product tanker space include Ardmore Shipping (ASC), Diamond S Shipping (DSSI), Navios Maritime Acquisition (NNA), Scorpio Tankers (STNG), and Torm Plc (TRMD).
Product Tanker Rates
Before we get to rates let’s get a brief reminder of the bloodbath we have seen since the start of the year in the product tanker segment.
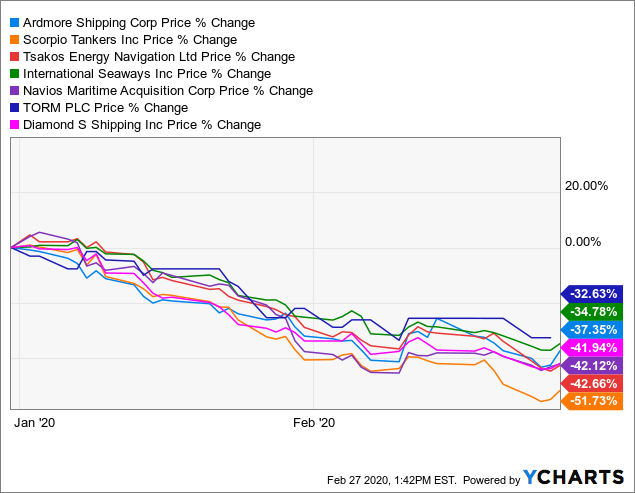
With 30% to 50% losses among companies associated with or exclusively engaged in the product tanker trade one would naturally think that rates had fallen off a cliff as well.
 Source: VesselsValue
However, MR rates have recently bounced back during what would normally be a declining market heading into the seasonal low. They are at their third highest point since 2016 and over double what they were this time last year.
Furthermore, we only saw rates nearing this level at the start of 2016 for a brief time as peak season was ending and the bullishly memorable 2015 came to a close. They never appeared in 2017 and only reached those levels in 2018 during peak season.
Finally, as expected, 2019 didn’t disappoint as rates held in solid territory for much longer compared to 2018, by approximately 6 weeks.
Yes, it’s very fair to point out that LR rates haven’t fared quite so well. Many suggest it’s because their crude tanker counterparts took a beating and there may be some truth to that, but a better answer is found when digging a bit deeper.
First, let’s start with a bold claim that the LR2 structural balance isn’t really as far out of alignment as rates might lead you to believe.
January 2020 cargo miles traveled for the LR2 class (98.42 bn DWT NM) appear about even compared to January 2019 (98.10 bn DWT NM).
February of 2020, which saw the massive impact from the Coronavirus, only saw a less than 5% drop in cargo miles traveled (84.63 bn DWT NM) compared to February of 2019 (88.70 bn DWT NM), for the LR2 class.
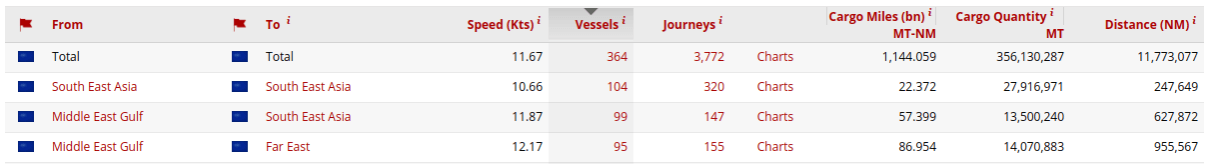
Consider the exposure this specific class has to East Asia, or better yet look at the top three regional routes for LR2s over the past year pictured below.
 Source: VesselsValue
In this context we can see why the drop in rates may have been so pronounced.
LR2’s present attractive economies of scale for long hauls like those from the MEG to Asia, where port infrastructure in both areas can support these large vessels as well as the supply/demand.
However, MRs will continue to have an advantage over LR2s in South America, the US and West Africa as many ports in these areas have restrictions based on the vessels’ DWT, draft, length, or width.
Therefore, these smaller vessels did much better than their larger counterparts in terms of the Coronavirus impact as their diverse trade routes relied less on impacted areas or the actual epicenter, whereas the LR2s were concentrated in the most affected areas.
LR rates will begin to bounce back as these trade routes are reestablished. Possibly much sooner than later due to the inelastic nature of refined products.
Could Shipping Stocks Be Discounting A Much Worse Market?
Transportation is a leading indicator, so goes the theory. For that to be true you need to look at data and not stock prices driven by sentiment.
Over the past five years that I’ve been covering shipping I’ve done quite a few dives into how, if, and when shipping stock prices begin to show the impact of a shifting market.
Sentiment has much to do with these moves as one might imagine, since shipping bear markets have been a recurring theme since the Great Recession.
The popular belief is that the market is some sort of forward discounting mechanism, and in many ways it is when things are in a perfect state. But shipping is anything but perfect.
In short, I’ve found that bear market reactions are much stronger and more swift as traders do not wait for bad news to manifest on the balance sheets or, as seen in this case, in the form of operating revenue (charter rates). They sell first and ask questions later.
However, when it comes to bullish shifts there is an equally strong reluctance or adversity to believe the forecasts. In February of 2016, when dry bulk found a bottom amid a historic downturn, there was no forward action in the stock market until dry bulk rates began moving up and the structural market balance improved.
For more on that you can turn to this July 1, 2017 report: Can Dry Bulk Stocks Offer Insight To Time A Tanker Market Recovery?
There you will find an analysis of vessel prices, stock prices, and market rates during this recovery and how they each unfolded during that recovery phase. Part of my conclusion read: “the market didn’t predict a recovery well ahead of time and rates provided the catalyst for a turn in stock prices. Stock prices responded to the rate bottom in a matter of days while asset values lagged behind by a couple months.”
It’s also noteworthy that crude tankers were in a bear market at this time and this analysis was a piece of the puzzle which again asserted a correct recovery timeline. I noted, “The conclusion of refinery maintenance in the spring of 2018 therefore provides the first somewhat promising macro backdrop for the beginning of a corrective phase. While that may be the first potential turnaround point, it is probably quite a bit early. A more likely date may come as the summer concludes.” Of course, we now know that October of 2018 presented the turnaround point where tanker rates emerged from the doldrums into profitability.
Getting back on track here – The point is that even following the biggest bloodbath in dry bulk history the market still observed fundamental developments, though it wasn’t anticipating them.
Currently, we have a market that isn’t even observing fundamentals.
For example:

 Notice that while MR rates are going one way Ardmore Shipping, a heavily intensive small product carrier, is seeing their fortunes go the opposite.
Given the historic lack of long-term forward visibility in shipping stock prices, which tend to track more of a reactionary sentiment, it is not a bold statement to say “this market is disconnected.” It is not permanently broken, but it is now being governed by sentiment, trading, algos, trends, technicals, etc.
No, shipping stocks are not pricing in Armageddon, they are simply a victim of being a very easy short trade target given its affiliation with China, energy, and the global supply chain.
Refined Products
Two things are worth reviewing at this point. One, the inelasticity of refined products. Two, the nature of the supply chain with regard to timing.
Refined products and crude are relatively inelastic during traditional economic activity. Meaning there is little room to curb use of these products.
Extreme economic shocks have played a role in past episodes of demand destruction, whether it be from recessions, crude price spikes, or in this case a black swan viral outbreak. However, normal patterns always return, or at least have until this point in history.
Therefore, as this outbreak runs its course we will see a return to trade normalization and fundamentals. This isn’t a bold claim when talking about the medium to long run, however, the short run is a bit dicey as it is highly dependent on when containment is achieved.
Trade normalization will take a bit of time to return and this is because of the timing involved in the supply chain.
Let’s start at the beginning, when cargoes were being shipped, both refined products for end use and crude feedstock. Those cargoes at sea were greeted with news of an outbreak in China which had a nearly instant impact on demand. Refined product demand fell and a glut began building up in the supply chain. Product which was set for end use was instead stored and that action worked its way all the way back through the refineries, tankers, and finally crude producers.
Now, consider the fact that the results of this demand destruction became apparent almost immediately throughout the entire supply chain. A supply chain that can extend several months out due to the nature of crude purchasing, loading, shipping, unloading, refining, distributing, and then using the end product. Even a supply chain that only involves the refined product transportation from one region to another could mean weeks.
Many economists are predicting a somewhat “V” shaped recovery and I am in that camp until we see far more worrisome statistics regarding the outbreak.
What this would mean is that once a meaningful return to normalization begins crude tanker rates should begin to move followed by product tankers.
But the potential now exists short-term crude and refined product demand to outstrip current market trading capabilities and eat into stockpiles due to the lengthy nature of the supply chain, especially in China.
As cargoes are quickly sourced to remedy this, the potential for a snap back rally in rates becomes present.
This could make for an interesting Q2 as refineries that would normally be under maintenance may be pressed to up utilization to make up for lost time and also take advantage of possibly more attractive margins. That’s a wildcard here. Will refiners undergo maintenance as normal? Or will they defer some till the end of the summer or perhaps next year?
Fundamentals
There is no question that fundamentals will return to eventually govern price action in the market again, the question is when? That I don’t have an answer for, but I can provide a bit of a guide as to what we can expect once we do see a return to normal.
Since the start of Autumn in 2018 we have seen a steadily improving market. Slowing vessel deliveries and growing cargo mile demand resulted in a tighter market and the forecast, up till the outbreak, was for that to continue through 2020 and into 2021.
Nothing major has changed.
The product tanker orderbook still looks favorable and the projected cargo miles traveled for this segment won’t suffer nearly as much stock price drops might have you believe.
Supply, Slippage, and Demos
First, let’s take an updated look at the product tanker orderbook.
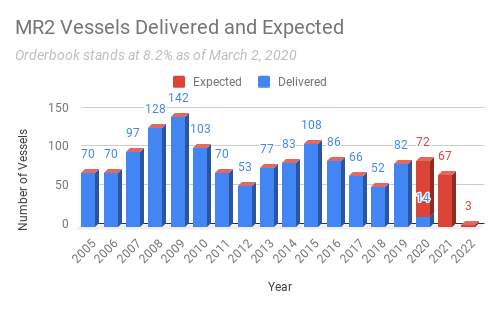 Source: Data Courtesy of VesselsValue – Chart by Value Investor’s Edge
While the MR2 delivery schedule is a bit thicker than I would like, absorbing 2020’s deliveries should be no problem.
But here’s a catch. All those vessels likely won’t be delivered. Clarksons has recently reported that all major shipbuilding regions had experienced delays or outright closures. One shipyard indicated delays up to six months. Remember, the supply chain for these vessels runs deep in Asia meaning slowdowns in China could be impacting Japanese and Korean shipbuilding to a degree.
In fact, 106 of those MR2 newbuilds are under construction in Japan, S. Korea, and China which significantly increases the chances of slippage for these vessels.
 Source: VesselsValue
Therefore, it’s quite likely that many of those remaining MR2s set for 2020 delivery will be delayed.
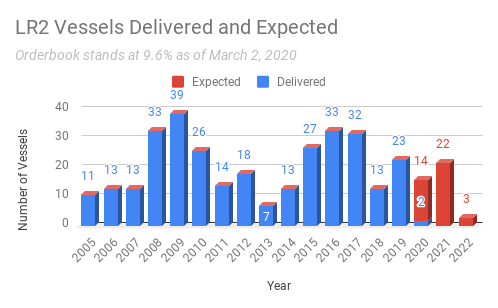
Additionally, let’s take a quick look at the LR2s while we are at it.
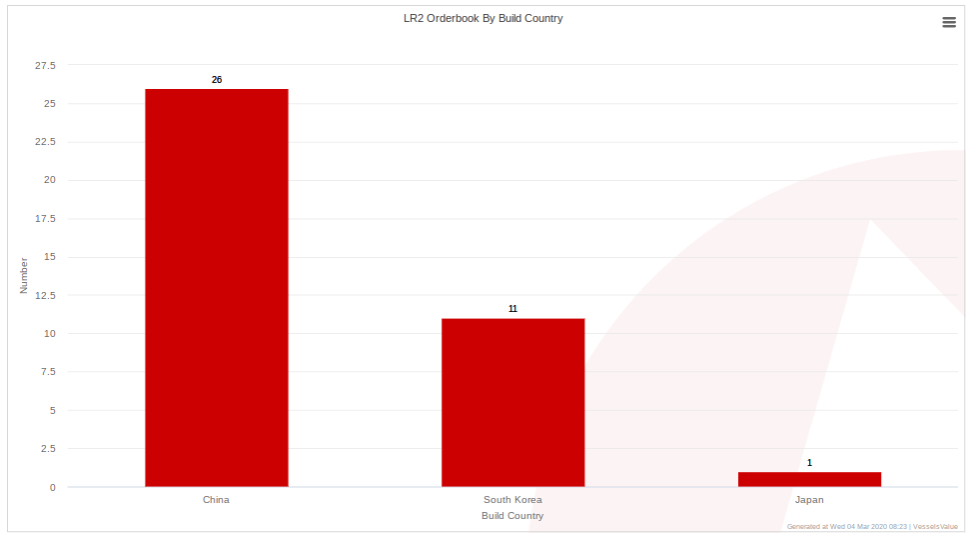 Source: VesselsValue
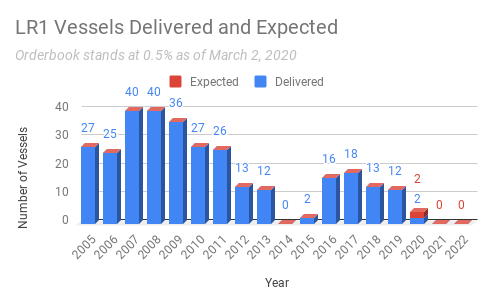
Finally, let’s just acknowledge that for product tankers any orderbook under 10% is attractive. LR2s are at 9.6%, LR1s come in at 0.5% and MR2s are looking at an 8.2% orderbook.
The orderbooks are already fairly bullish, but the potential for delayed deliveries and therefore lower than expected gross fleet growth improves near term prospects.
Gross fleet growth measures the number of vessels entering the market while net fleet growth measures the number entering minus those being retired (demolitions).
The dynamic between net fleet growth and cargo mile growth make up the supply/demand equation with price being that of charter rates.
As many might expect there is an inverse correlation between rates and demolition activity. If rates are low, or loss making, owners will part with a vintage vessel without a second thought, sometimes even earlier than expected if a prolonged bear market is in the forecast. Conversely, if rates are good owners will endeavor to keep as much tonnage on the water to capitalize on this cyclical window of opportunity.
Demolitions are largely dictated by the current market and short-term forecasts.
Before we get to this let’s recap a section from the January Product Tanker Outlook for 2020:
The MR2 fleet is poised for 5.2% gross fleet growth in 2020, but I am skeptical on this one. 91 vessels are expected, but I went through the current orderbook and found far too many aggressive timelines. Yes, a MR2 can be built in 12 months but that isn’t typical. Nor are the 14-16 month timelines I see on these completion dates for a great number of vessels throughout the year.
Looking at the completion times for dozens of recent vessels we find outliers, like a single 12 month completion or several 4.5+ year build times, but it’s safe to say 16-24 months appears to be a good average bet.
Therefore, it seems reasonable that deliveries this year will likely number in the high 60’s to low 70’s, which would be very manageable for the market.
Gross fleet growth for the MR2 class has already been revised down since that point to 4.9%. However, that number will most certainly never materialize due to the reasons listed above but also because of Coronavirus linked shipyard delays due to labor shortages and supply chain snafus which will likely result in greater than previously projected slippage. Therefore, gross fleet growth for the MR2 segment will likely reach about 3.4% or perhaps even lower.
The LR2 class is set for 3.9% gross fleet growth, but will likely be closer to 2.6% due to organic slippage combined with those shipyard delays.
If those gross vessel addition numbers for MR2s and LR2s come to fruition (taking into account the very low number of LR1s being added) and total cargo mile demand growth for 2020 comes in upwards of 2.8% we are looking at a tighter market without any demolitions.
But we have already seen two LR2s and two MR2s sent to the beaches in 2020, all in the 20-25 year old age range. Furthermore, there are significant scrapping candidates in both classes.
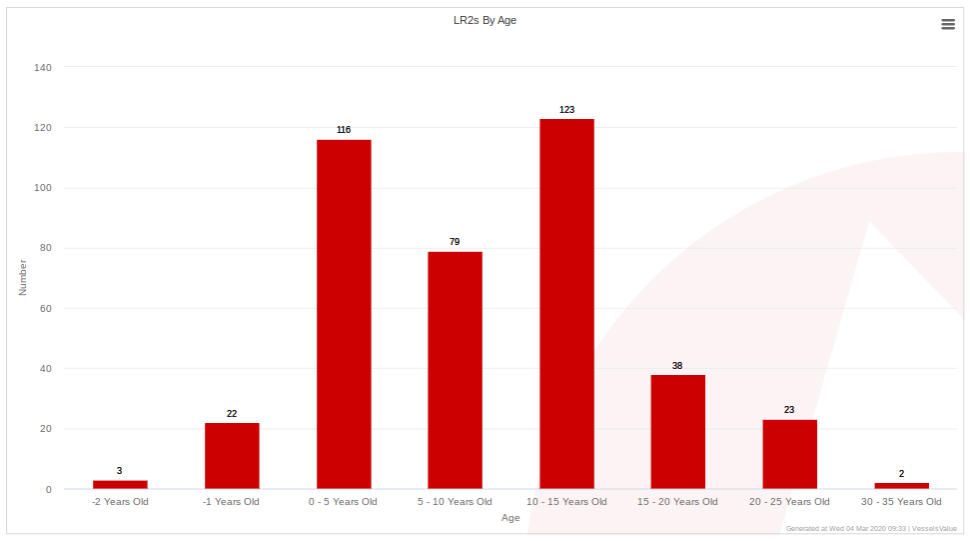 Source: VesselsValue
Of these LR2 vessels, 6 in the 20-25 year old age range have special surveys coming up before the end of the year as well as a single vessel in the 15-20 year old range. None of them have the required BWT systems or are scrubber equipped.
For the MR2 segment we see a decent number of candidates in the 20-25 year old age range.
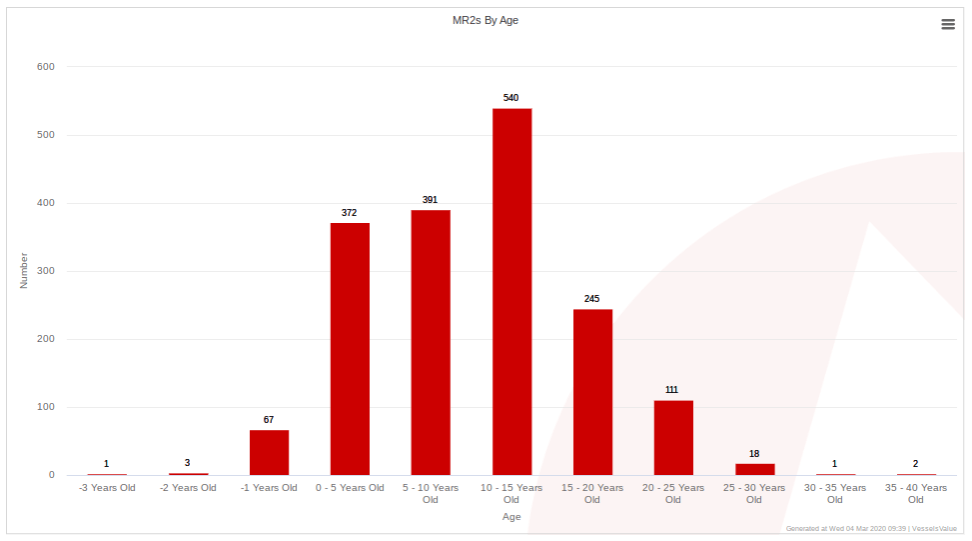 Source: VesselsValue
Those with special surveys due are shown below.
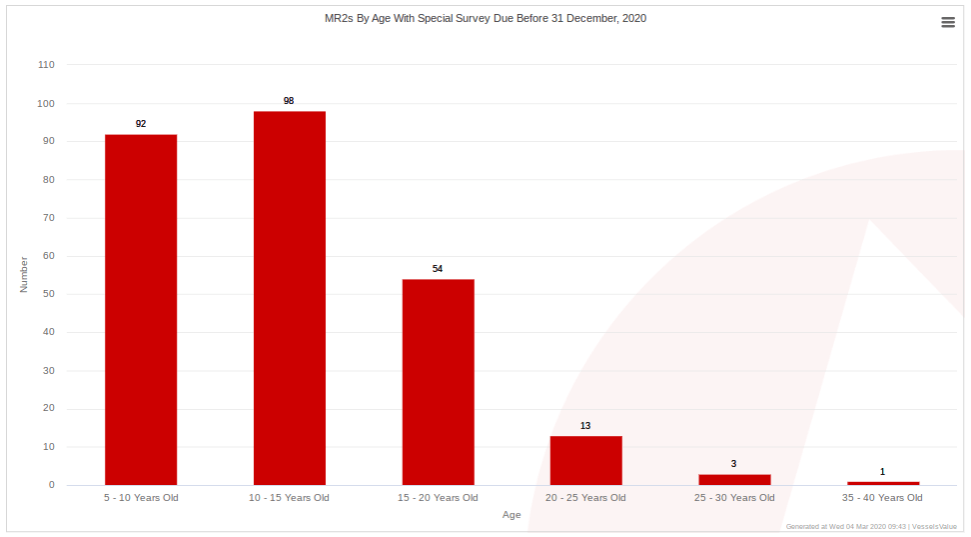 Source: VesselsValue
Out of those over ten years old and due for a special survey, only four vessels in the 10-15 year old range have the BWT. Of course, due to their smaller size and age none are scrubber equipped.
The point is there are candidates and reasons to scrap. With some generous demolition activity we could actually see net fleet growth come in a full percent under gross fleet growth.
Cargo Miles
But will cargo miles keep pace with vessel growth?
YTD as of March 3, we are only 0.69% below where we were this time last year in terms of cargo miles traveled.
 Source: VesselsValue MR2 Projections as of March 3, 2020
VesselsValue has projected that this quarter will see a slight gain in cargo miles traveled over Q1 of 2019. Yes, a slight gain! Honestly, I would have settled for a 2-3% drop over last quarter.
Those that follow Ardmore Shipping are familiar with the next chart which shows cargo mile growth over the past years for product tankers.
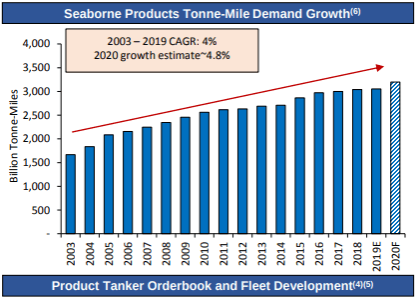 Source: Ardmore Shipping
Notice, the 2008 and 2009 years. When every other major shipping segment was experiencing a contraction in either one or both of those years, product tankers continued to witness gains.
Next, look at the jump from 2014 – 2019. This was brought on by two major developments. First, low crude prices which inspired stockpiling thereby increasing demand. Second, a growing dislocation between refineries and end users which increased cargo miles.
Now consider the current crude price environment and the fact that China is seeing a massive jump in refinery capacity which isn’t required to fulfill domestic demand, therefore, products will be exported.
The economies of scale for these modern mega refineries will inevitably eat away at other neighboring nations’ domestic producers market share. This will lead to a growing trade in products which would benefit MRs the most in the SE Asia region.
With China being heavily crude import dependent this dynamic bodes well for crude tankers, especially VLCCs, as well.
Finally, Ardmore issued this report on February 11, the height of Coronavirus panic. Notice the 2020 forecast calling for 4.8% cargo mile demand growth, which would outpace supply side growth further tightening the market and leading to higher charter rates. This was expected as IMO 2020 and Chinese refineries were all expected to be big stories.
But how is that holding up? I modeled a few different scenarios and found between 0.5% and 0.8% deviation from projections could come as a result of the outbreak. A much smaller amount than I would have thought so I spent quite a bit of time on this (more than I care to admit) but my findings remained consistent.
What I did find is that MR loadings have remained fairly steady, MR rates (and recovering LR rates) are signaling a pretty tight market, cargo miles while they did take a brief hit are bouncing back, and the potential for stockpiling is as high as it’s been since 2015.
It’s worth pointing out that the last four weeks have seen 282 combined loadings for LR2 vessels. This compares with 273 which took place in the last four weeks of 2019 and prior to the impact of the Coronavirus. This demand during what would typically be a slower than average time of year indicates a bit of a demand uptick from the push back effect – where cargoes were diverted but demand wasn’t lost.
Could that 4.8% actually come to fruition? It’s going to be a tough chore and estimates like 3.5% – 4% cargo mile growth could be a bit more realistic at this point. But again, even that would outpace net fleet growth and lead to a tighter market.
What if?
Yes, be skeptical of any section that starts with that heading.
But, what if the demand destruction we have seen will be mitigated or even negated by not only vessel slippage but the potential for increased demand through opportunistic or cautious stockpiling over the course of 2020?
Right now we have experienced the brunt of demand destruction, however, the consequences of this outbreak with regard to slippage won’t be felt until much later.
The same can be said for any stockpiling effort which may come as a result of these low crude prices and products later on – courtesy of an aggressive V shaped restart of refineries which could keep prices down.
It might not just be price sensitive opportunistic stockpiling that we see either. This latest situation has highlighted the delicate nature of global supply chains. Governments would be wise to prepare for situations that could disrupt the market for several months and right now many nations are not at that level.
Therefore, the potential exists for market normalization to be met with slower than expected deliveries and possibly greater stockpiling. This would actually lead to greater than forecast market strength over the affected period of time.
Newbuilds, S&P, Asset Prices
Think prospects are bad? Owners don’t. In January and February of 2019 we saw a total of 11 orders placed for product tankers (MR2, LR1, LR2). But in 2020 over that same period we have seen 17 orders. This isn’t a bad thing and the market can absolutely handle this level of action.
In fact, it’s a good sign for two reasons. First, continuing faith in forward prospects. Second, that during this whole situation, when the markets seem to be going crazy, these owners continued on with business as usual.
However, going forward I would like to see owners place far more emphasis on second hand vessels. S&P activity for the MR2 class is lagging so far in 2020 compared to 2019. With rates rising we should begin to see greater interest in this market but also a corresponding move in asset prices.
It’s noteworthy that LR2s have seen a pickup in activity with 50% of 2019’s total already being traded, which is being reflected in their asset prices as of late.
Since the start of 2020 only the LR class and crude Aframaxes have seen an increase in value for vessels 8 years or younger. MRs join the party from year 9 onward with vintage 20 year plus vessels seeing the biggest percentage gains, though none exceeding 5%.
On a side note, want to know where the biggest asset price gains have been since the start of the year? 15-20 year old Suezmaxes have seen upwards of 8%.
The biggest disappointment has been the VLCCs which are down across the board due to the fact that they make up a vast majority (75%) of China’s import capacity. However, they make for a solid comeback story as China restarts. In fact, 5-15 year old VLCCs are my top pick for the next six months.
Conclusion
This is a lot to digest, and I threw in a few wildcards, so let’s just do a very easy summary. Of course, all of this assumes containment of the outbreak at this point, or only small recurrences.
Stock prices are down as shipping made for a very easy China/Energy/Global exposure short trade. It was just too easy for traders to ignore. But as the trade fades and life across the globe returns to normal, so to will shipping stocks find their values reconnected to fundamentals.
Fundamentals remain largely intact. Cargo mile demand destruction for product tankers did occur but not to a large degree and it certainly could have been much worse. Cargo loadings appear to be healthy, MR rates are strong and LR rates are recovering and likely to return to more than acceptable levels before mid year.
The supply outlook just got a whole lot better as a high degree of likely slippage in the MR class was met with delays and outright shipyard work stoppages.
The supply/demand balance looks to favor a tighter market by the year’s end as cargo mile demand growth should outpace net fleet growth.
If a global recession does erupt history shows that refined product demand holds up well and downward demand revisions won’t be too dramatic.
Right now, the market is disconnected and for experienced traders only.
If you must enter, as I am feeling slightly compelled to do at this point, do not catch knives. Over time, try catching many of those little plastic swords that skewer fruit on adult beverages. Meaning trickle in. And if that doesn’t work at least you have those beverages standing by.
Value Investor’s Edge
A membership to Value Investor’s Edge includes exclusive work from J Mintzmyer, James Catlin, and Michael Boyd, along with occasional contributions from guest authors. Members will always receive a first look at new ideas, trades, and in-depth research reports. We offer a quarterly review of alternative income opportunities, and we post a weekly update with the latest value opportunities, research development, market analytics, and current trades. Furthermore, we do full ‘earnings season’ coverage of our focus coverage firms. Finally, we offer a full suite of exclusive market analytics for the shipping sectors and for income opportunities.
Disclosure: I am/we are long DSSI, ASC. I wrote this article myself, and it expresses my own opinions. I am not receiving compensation for it (other than from Seeking Alpha). I have no business relationship with any company whose stock is mentioned in this article.
Editor’s Note: This article covers one or more microcap stocks. Please be aware of the risks associated with these stocks.


