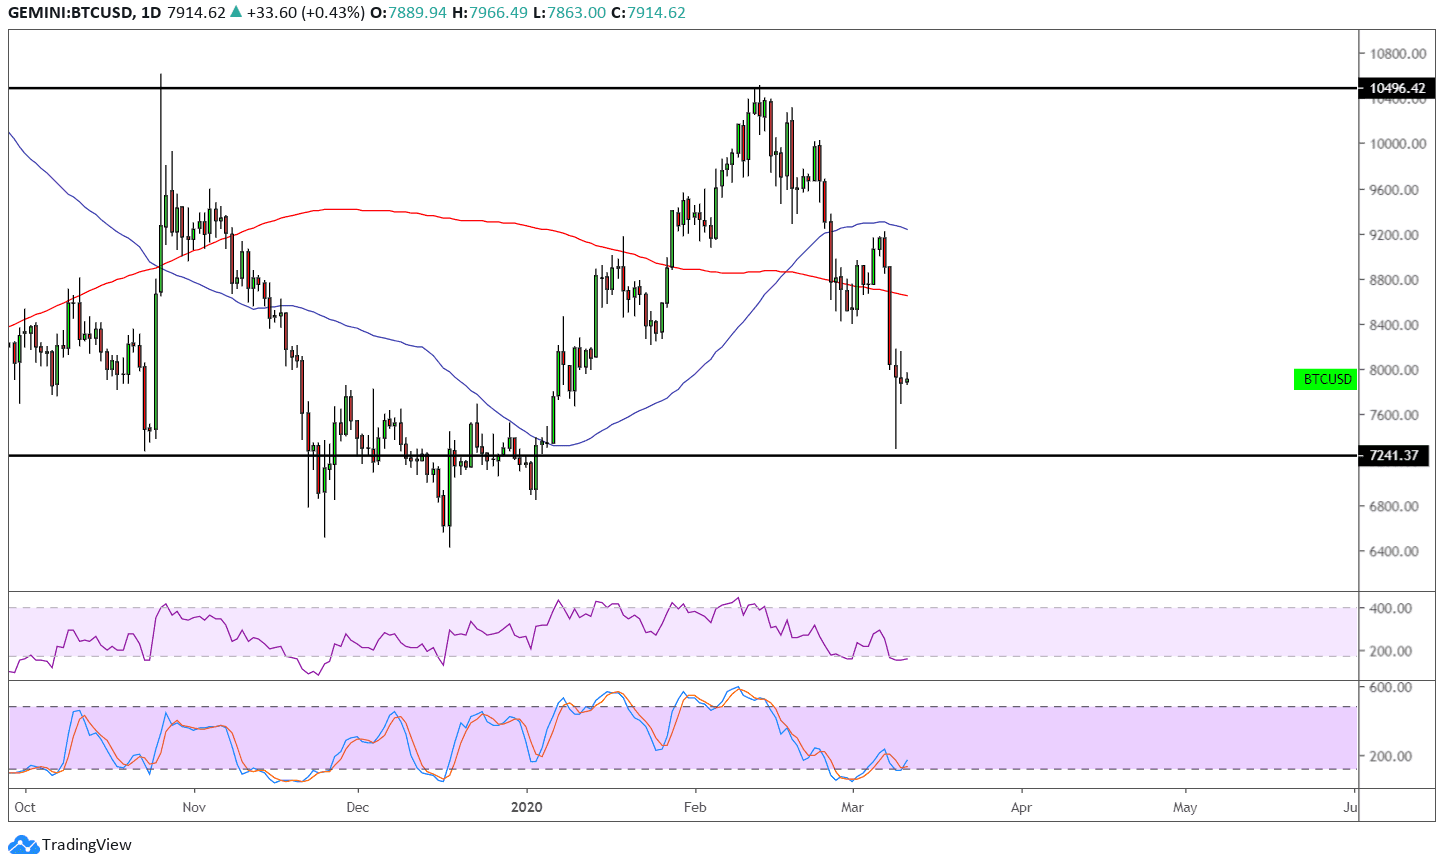
Bitcoin could start moving sideways from here as price tests the bottom of its range around the $7,200 mark and forms a reversal candlestick. A bounce could take price back up to the range resistance around $10,500.
The 100 SMA is above the 200 SMA to indicate that the path of least resistance is to the upside or that support is more likely to hold than to break. Then again, price is moving below both moving averages as an indicator of bearish pressure and the indicators might merely be oscillating to reflect range-bound conditions.
RSI is heading lower to show that selling pressure is in play, but the oscillator is already dipping into the oversold region to reflect exhaustion. Turning back up could draw buyers back in and lead to a bounce back to the range resistance.
Similarly stochastic is indicating oversold conditions or exhaustion among sellers and looks prime for a move back up to show that buyers are returning. A break below support, however, could set off a drop that’s around the same height as the rectangle chart pattern.

Bitcoin has not been immune to the market selloff sparked by the coronavirus outbreak and the oil price rout. In some cases, cryptocurrencies have acted as safe-havens of sorts as traders flee from traditional holdings like stocks and commodities, but this does not seem to be the case these days.
Traders might still be hoping that stimulus efforts from governments and central banks could be enough to limit the economic impact of the outbreak, thereby keeping markets supported. In that case, stocks and commodities could be prime for a big rebound soon and the recent declines might offer opportunities to go long at better prices.
Still, it’s worth noting that bitcoin is approaching the halving of mining rewards in May, which could lead to as much as double the value of the coin down the line.
Images courtesy of TradingView


