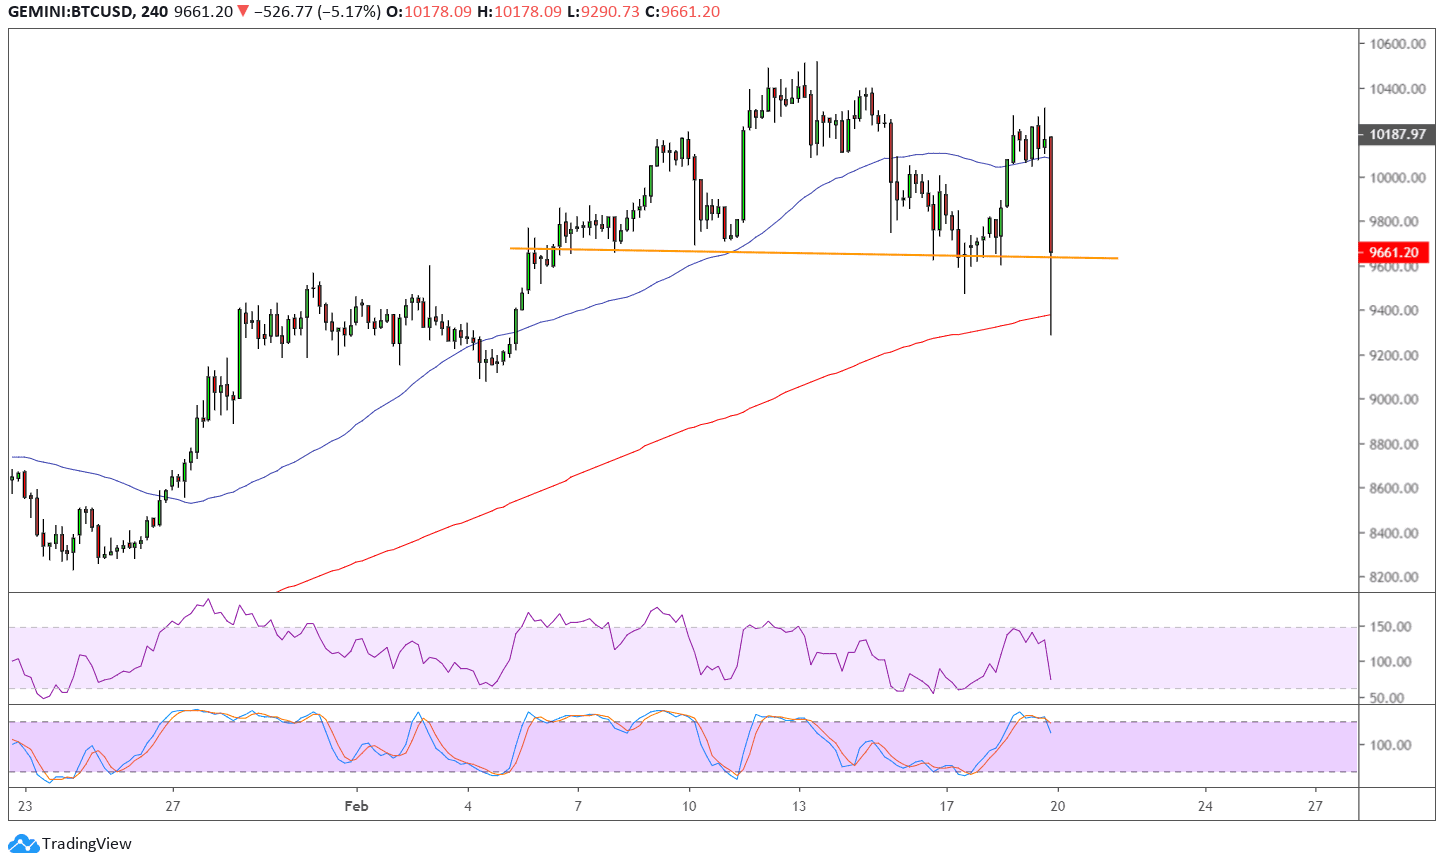
Bitcoin formed a head and shoulders pattern on its 4-hour chart to signal that a reversal from the climb is due. Price already dipped below the neckline of the chart pattern to indicate that a selloff of the same height as the formation is about to follow.
However, the 100 SMA is still above the 200 SMA to indicate that the path of least resistance is to the upside or that the climb is more likely to gain traction than to reverse. Bitcoin is testing support at the 200 SMA dynamic inflection point and a bounce could take it back to the nearby resistance levels. A move below it, on the other hand, could set off a drop that’s roughly $900 in height.
RSI is heading south so price could follow suit while sellers have the upper hand. This oscillator is nearing oversold conditions, though, so sellers might need to take a break soon. Stochastic is also heading lower from the overbought region to reflect a return in selling momentum. This oscillator has plenty of room to head south before reflecting exhaustion among sellers.

Bitcoin is losing its luster as risk appetite continues to improve in financial markets. Stimulus measures from China to battle the impact of the coronavirus outbreak seems to have eased fears that a global recession is underway. At the same time, the pledge of easing from other affected nations is also keeping investors hopeful that risks could be abated.
However, bitcoin is still looking forward to the halving of mining rewards in May as this could potentially double the coin’s value. Then again, this event has been priced in for quite some time, so the actual impact might be limited or could take a long while to materialize.
Images courtesy of TradingView


