
BNB Price Analysis – February 21
Binance Coin (BNB) is currently moving at $22.40 and the price fall that occurred a few days ago delays its quick recovery.
BNB/USD Market
Key Levels:
Resistance levels: $27.0, $28.0, $29.0
Support levels: $18.0, $17.0, $16.0
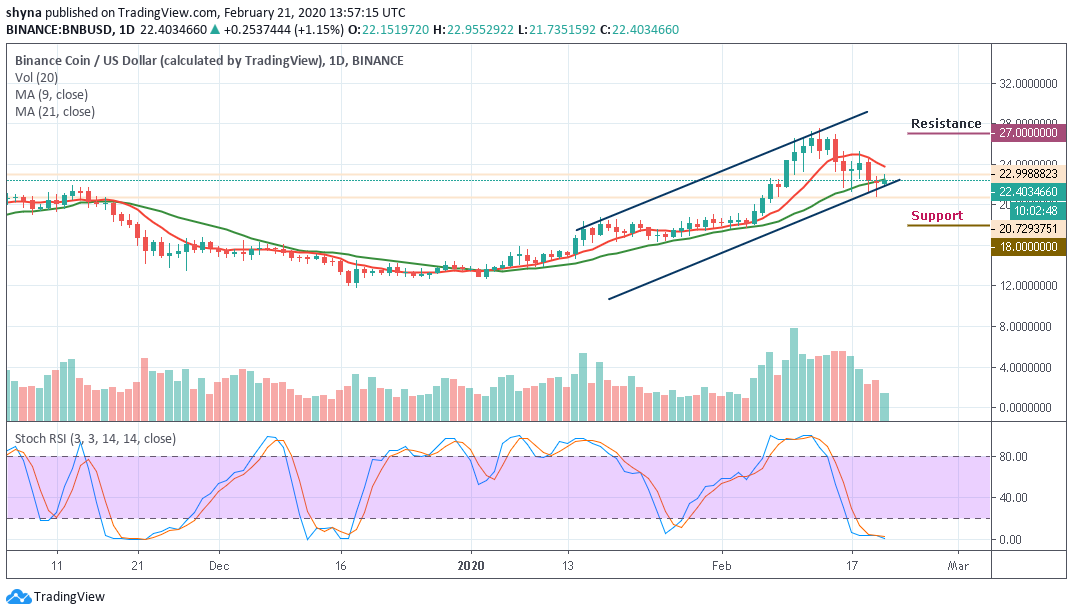
BNB/USD is still following the downward trend. A week ago, the coin started the downtrend and has not recovered. BNB/USD moved below the 9-day and 21-day moving averages. In addition, there does not seem to be any sign of improvement with the intraday price movement which encourages traders to rethink their investment option.
Moreover, BNB/USD pair is likely to rise if the bulls defend the $20 support level. In other words, if the bulls break the $24 resistance level, the coin may resume its upward movement and could hit $27, $28 and $29 resistance levels. However, the analysis will be invalidated if the bears break the $20 support level, and the price of Binance Coin (BNB) may likely fall to the low of $18, $17 and $16 support levels.
Meanwhile, the stochastic RSI is already in the oversold zone; possible buying pressure is likely if it turns upward.
BNB/BTC Market
When compared with BTC, the pair is moving within the descending channel. In as much as the price actions keep respecting the channel formation, Binance Coin may remain perpetually under the control of bear radar. Meanwhile, the traders need more strong and consistent resistance to snatch BNB from the bear-run.
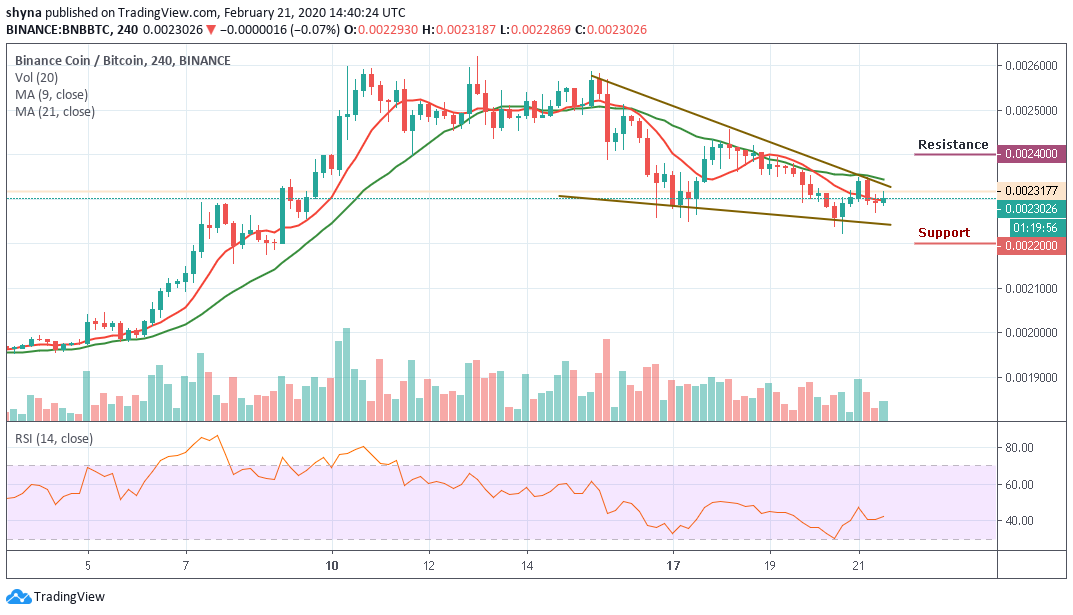
For now, with the current movement in the chart, if the price breaks below the 9-day moving average, it may likely reach the critical support levels at 0.0023 BTC and below. In other words, if the market could break above the 21-day moving average, the price of BNB may likely hit the resistance level of 0.0024 BTC and above as the RSI (14) moves above the 40-level.
Please note: Cryptovibes.com is not a financial advisor. Do your research before investing your funds in any financial asset or presented product or event. We are not responsible for your investing results.


