
- Both the 20-day Bollinger Band and the RSI indicator show that the price is overbought.
- MACD and Elliott Oscillator both indicate bullish sentiment.
EOS/USD daily chart
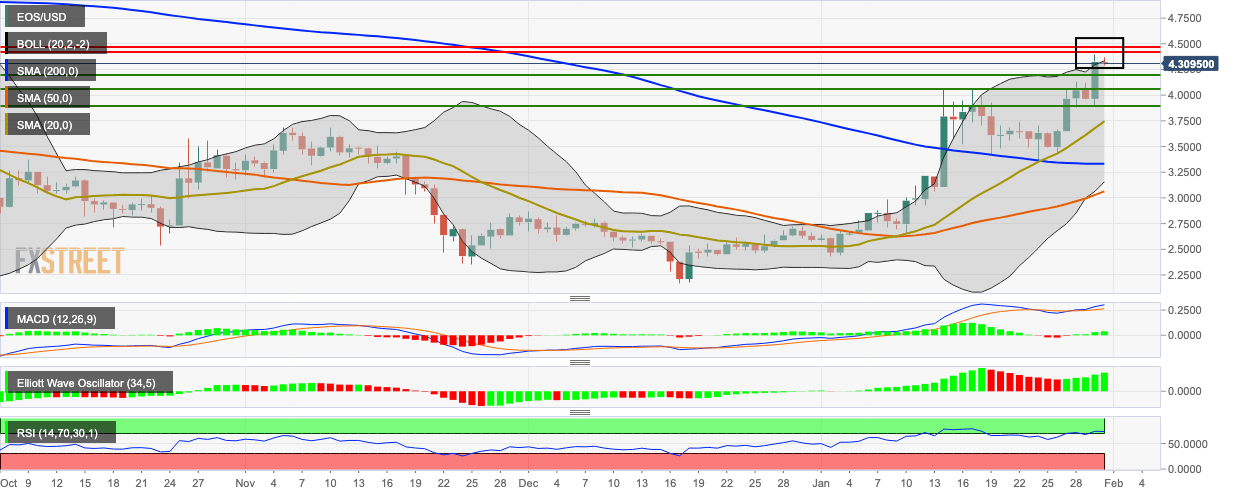
EOS/USD bears stepped in to correct the market after this Thursday’s bullish movement from $3.96 to $4.32. During Thursday’s movement, the bulls pushed EOS/USD above the 20-day Bollinger Band and the RSI indicator into the overbought zone. So far this Friday, the price has dipped slightly to $4.298 and back into the Bollinger Band. The price is still hovering above the SMA 20, SMA 50 and SMA 200. The MACD indicates increasing bullish momentum, while the Elliott Oscillator has had five straight green sessions. What this tells us is that the overall market sentiment is still bullish despite the price correction.


