
- Ethereum price is trading in the red by 0.80% in the session on Tuesday.
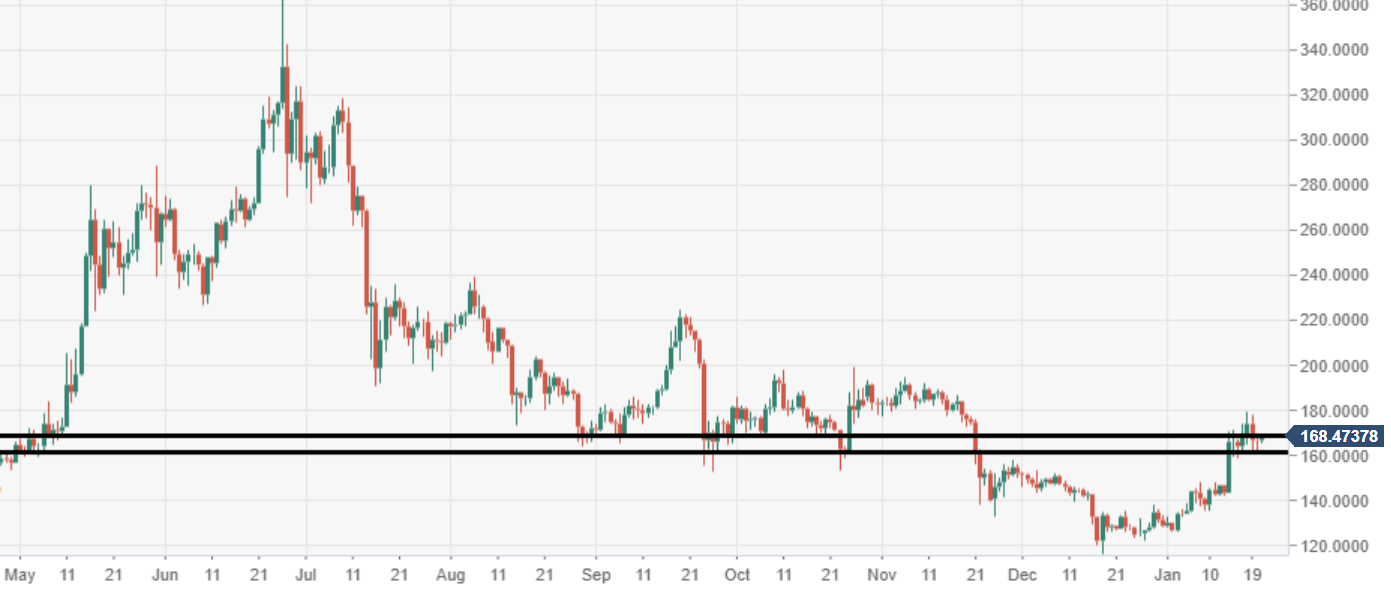
- Critical weekly support is being tested by the bears at the $165 mark.
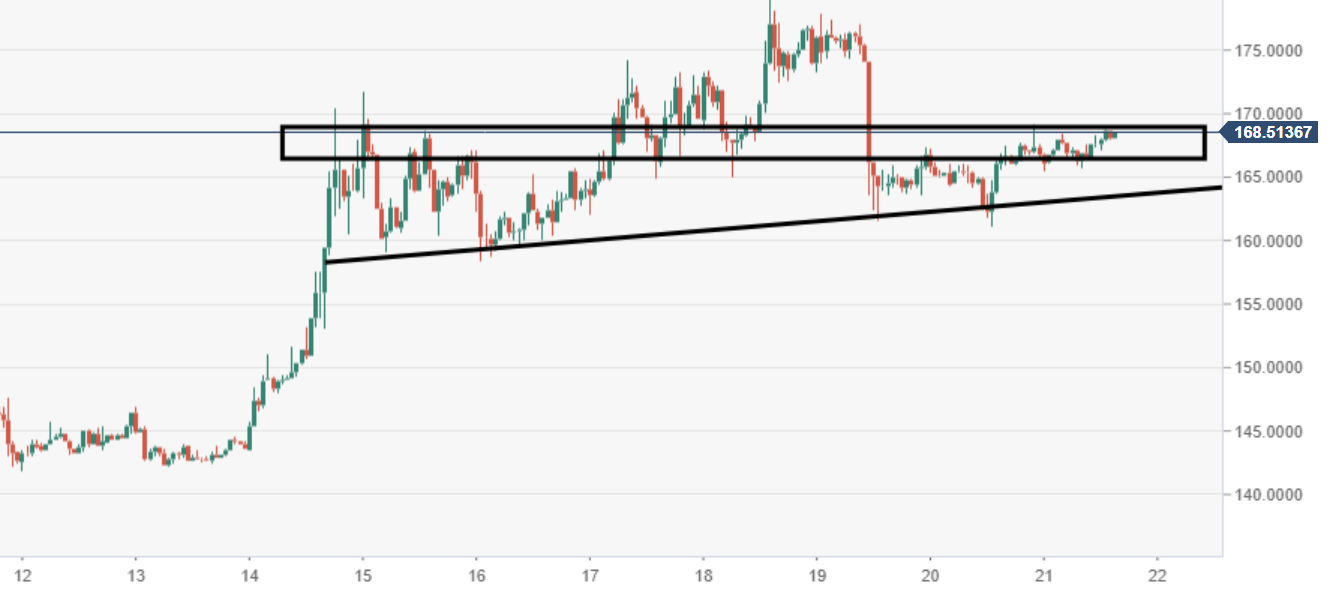
- Near-term price behaviour shows some vulnerabilities to the downside for ETH.
ETH/USD daily chart
Price action via the daily view has been consolidating for the last seven sessions. Next committed move is imminent.
ETH/USD 60-minute chart
Near-term price action is moving within a bearish flag structure, should the bears capitalize on this, selling pressure could be harsh.
Spot rate: 168.20
Relative change: -0.80%
High: 168.78
Low: 165.41


