
- BTG/USD is currently sitting on the upper curve of the 20-day Bollinger Band.
- The Relative Strength Index (RSI) indicator dropped from 64.85 to 56.75.
BTG/USD daily chart
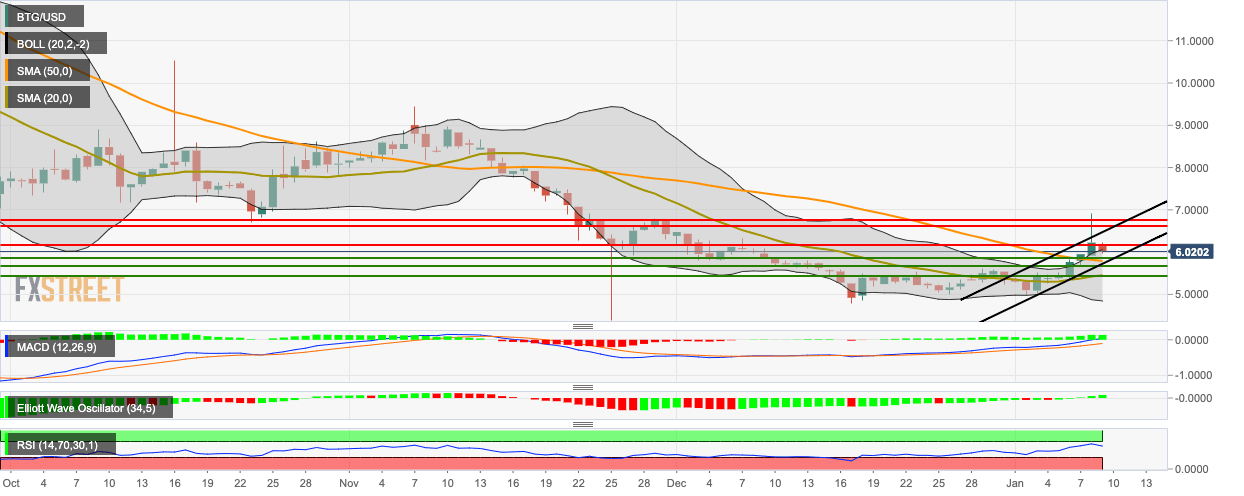
BTG/USD had a bearish session this Thursday after charting five straight bullish sessions. Currently, BTG/USD has dropped from $6.14 to $5.98. The latest price session is sitting on the upper curve of the 20-day Bollinger Band and is hovering above the 20-day Simple Moving Average (SMA 20) and SMA 50 curves. The Moving Average Convergence/Divergence (MACD) shows sustained bullish momentum, while the Elliott Oscillator has had five straight green sessions. The bulls will need to protect the $5.89 support line to prevent further downward movement.


