Tron (TRX) Price Analysis – January 6
The TRX/USD pair is maintaining an uptrend as the bulls come together to increase buying pressure in the market.
TRX/USD Market
Key Levels:
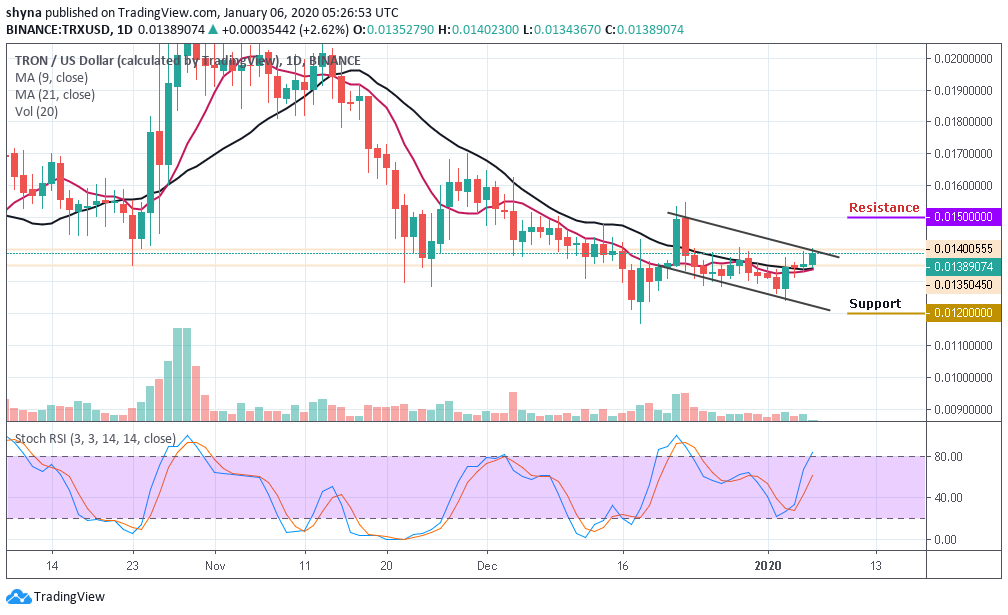
Resistance levels: $0.015, $0.016, 0.017
Support levels: $0.012, $0.011, $0.010

As it appears on the daily chart, Tron (TRX) remains in an upward movement recording a 2.62% positive change. Similarly, as the bullish movement continues, the next level of resistance lies at the $0.015 and $0.016. Further rise above this price levels may push the price to $0.017 resistance.
However, considering a downtrend for TRX/USD pair, we need to see a movement below the 9-day and 21-day moving averages that could bring the coin to $0.012, $0.011, and $0.010 support levels. As we can see on the daily chart, the trading volume appeared low for the past 10 days while the RSI (14) is making an attempt to move into the overbought territory.
TRX/BTC Market
Against Bitcoin, TRX is currently changing hands at 185 SAT and if the bulls can hold the price tight as it is, the next key target price lies at 195 SAT and 200 SAT respectively. Reaching these levels may likely move the market to the 205 SAT level. Meanwhile, RSI (14) has been moving in sideways for the past few days, making the market to be indecisive for now.
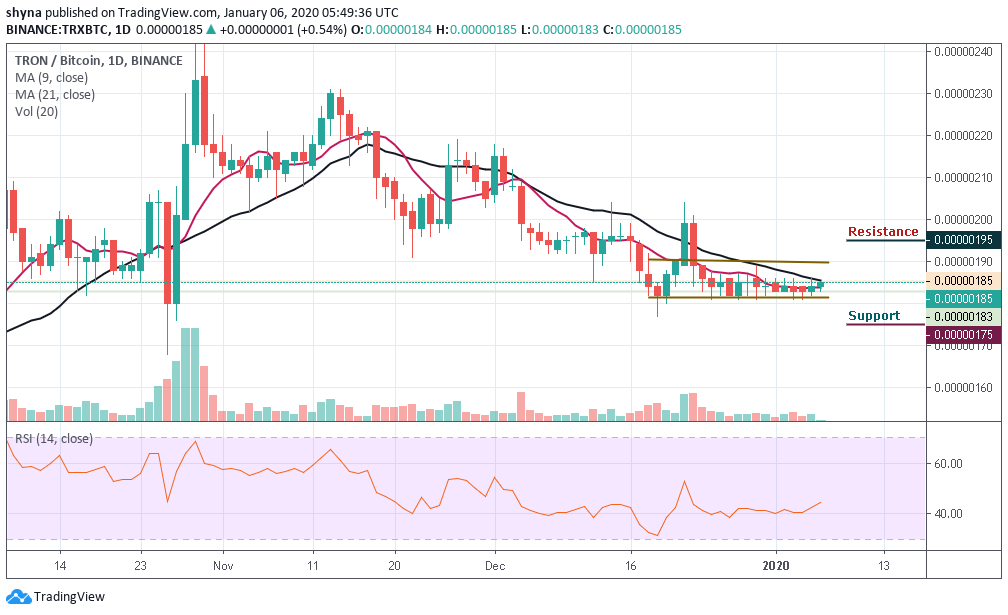
As it is, if the bulls failed to push the price to the nearest resistance, the market could resume its bearish trend and TRX/BTC may likely see a sharp drop crossing below the channel at 180 SAT support level under the 9-day and 21-day moving averages. Breaking this level could further bring the market to the nearest support levels at 175 SAT, 170 SAT, and 165 SAT.
Please note: Cryptovibes.com is not a financial advisor. Do your research before investing your funds in any financial asset or presented product or event. We are not responsible for your investing results.


