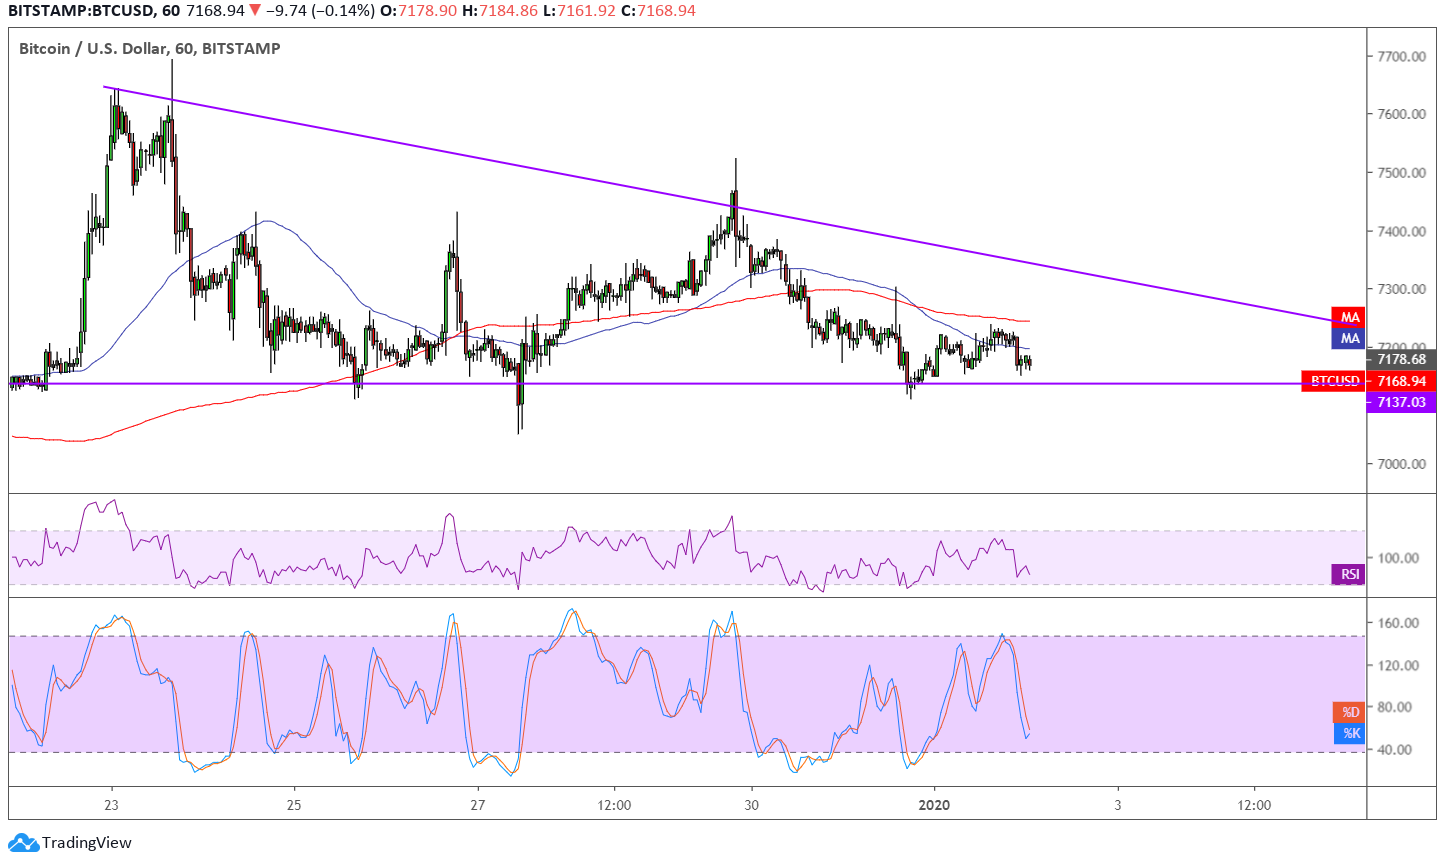
Bitcoin formed lower highs and found support at the $7,170 area, creating a descending triangle pattern on its 1-hour time frame. The price is testing support and a break lower could take it down by the same height as the chart formation, which spans close to $500.
The 100 SMA is below the 200 SMA to confirm that the path of least resistance is to the downside or that support is more likely to break than to hold. In addition, both moving averages seem to be holding as dynamic resistance.
RSI is pointing down to indicate that selling pressure is in play and that bears have enough energy to push prices south before seeing oversold conditions. Stochastic is also heading lower to indicate that sellers have the upper hand, and this oscillator has room to go before reflecting oversold conditions.

Still, many believe that this year could mark the start of bitcoin’s bull run as the halving of mining rewards is due to happen soon. Cutting the mining rewards in half could potentially double the coin’s value, although this could take years to happen. Besides, many already warn that this phenomenon has been priced in for quite some time and that bitcoin doesn’t have much upside left.
Volatility is expected to tick higher as the year rolls along, although much of it still hinges on fears of stricter regulation among monetary authorities, particularly in the US and China. Recall that US officials have expressed strong concerns about the industry during the Facebook Libra hearings in Congress while the latter also hinted that they could step up their regulatory game.
In any case, investors might keep holding out until stronger catalysts emerge, keeping bitcoin stuck in consolidation while the market waits for more clues.
Images courtesy of TradingView


