- GBP/USD is about to end 2019 on strong note.
- The 1.3400/1.3600 price zone are the levels to beat for bulls in 2020.
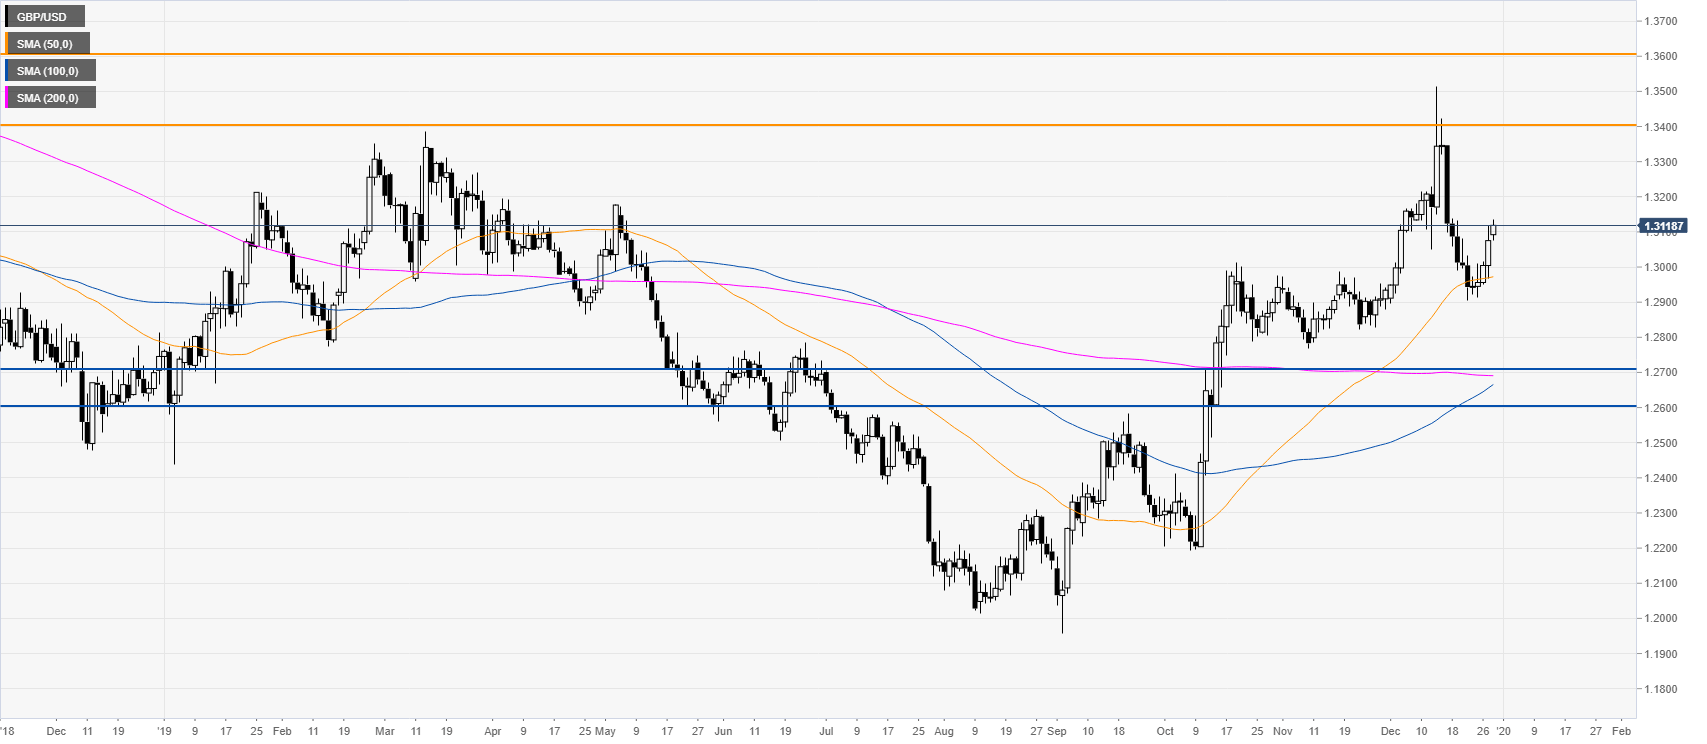
GBP/USD weekly chart
The cable is trading off the 2019 high above the 1.3000 big figure. The market is also challenging a downward sloping 200-period weekly simple moving average (SMA). Since August this year, the market essentially reversed course and 2019 can bee seen as a potential reversal year for the pound. If the buyers can have a weekly close above the 1.3400/1.3600 price zone in 2020, it would probably be a strong indication that further gains are on the cards.

GBP/USD daily chart
The spot is trading above a flat 200-day SMA while holding above the 50 SMA. However, the strong rejection near the 2019 highs can indicate further consolidation ahead. The current bullish bias would likely weaken on a daily close below the 1.2700/1.2600 price zone as this was an important support/resistance in the past year.
GBP/USD four-hour chart
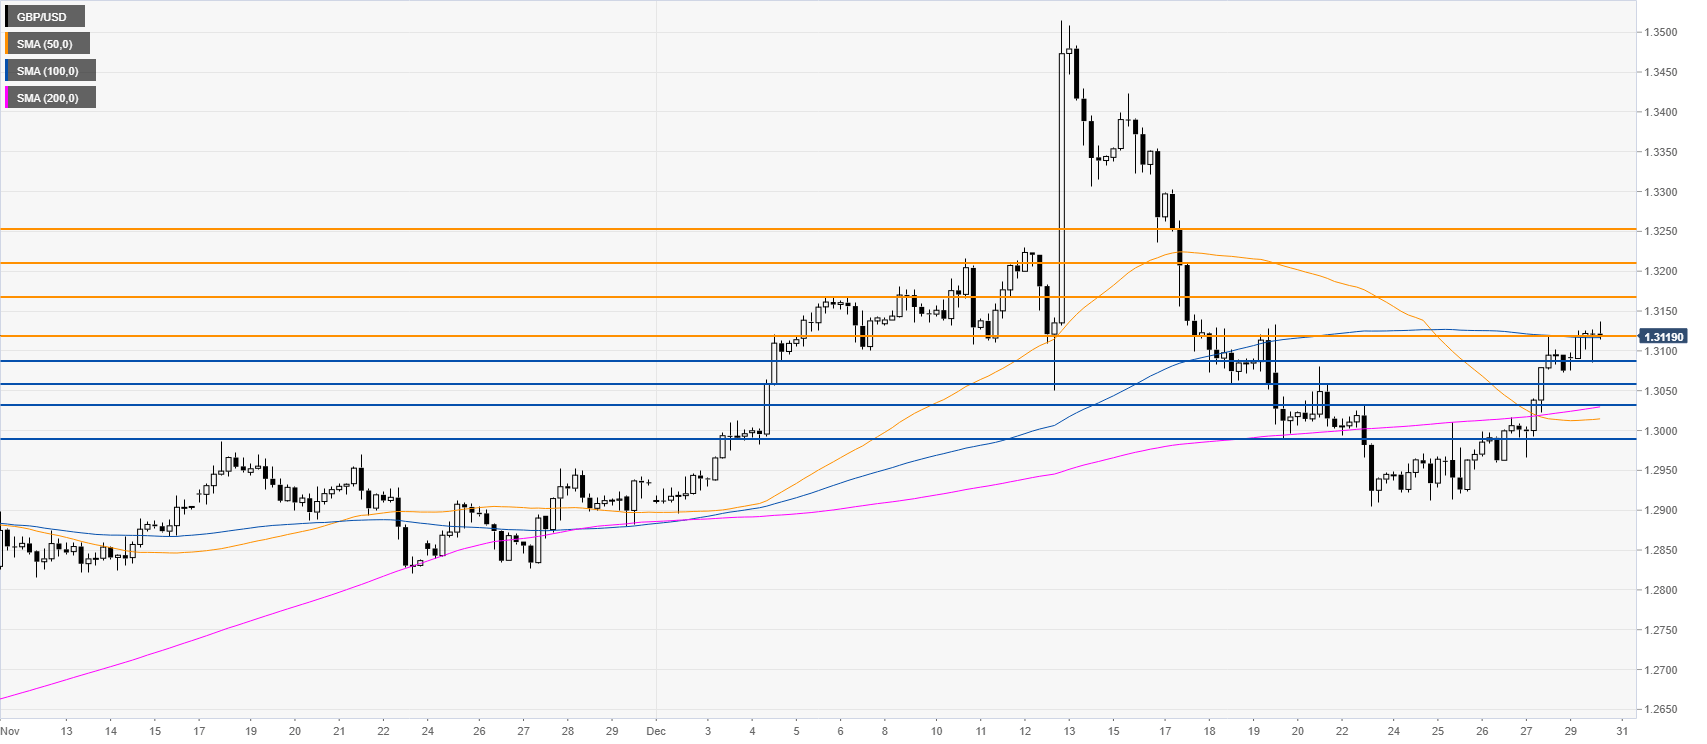
Additional Key Levels


