
- EUR/USD is pulling back down slightly in the New York session.
- The level to beat for bulls is the 1.1120/32 resistance level.
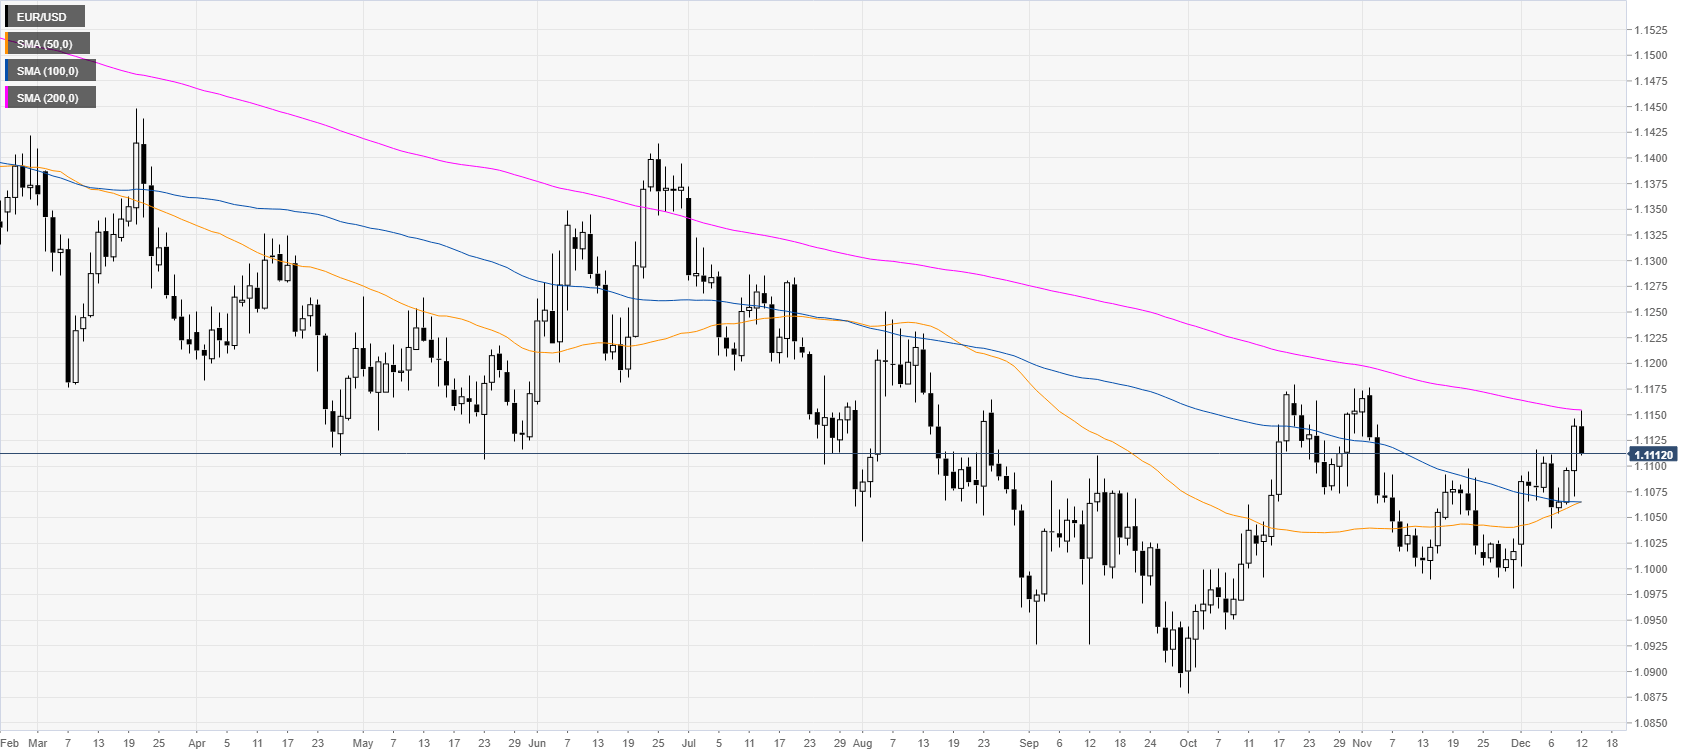
EUR/USD daily chart
The common currency is rejecting the 1.1150 level and the 200-day simple moving average (DMA).
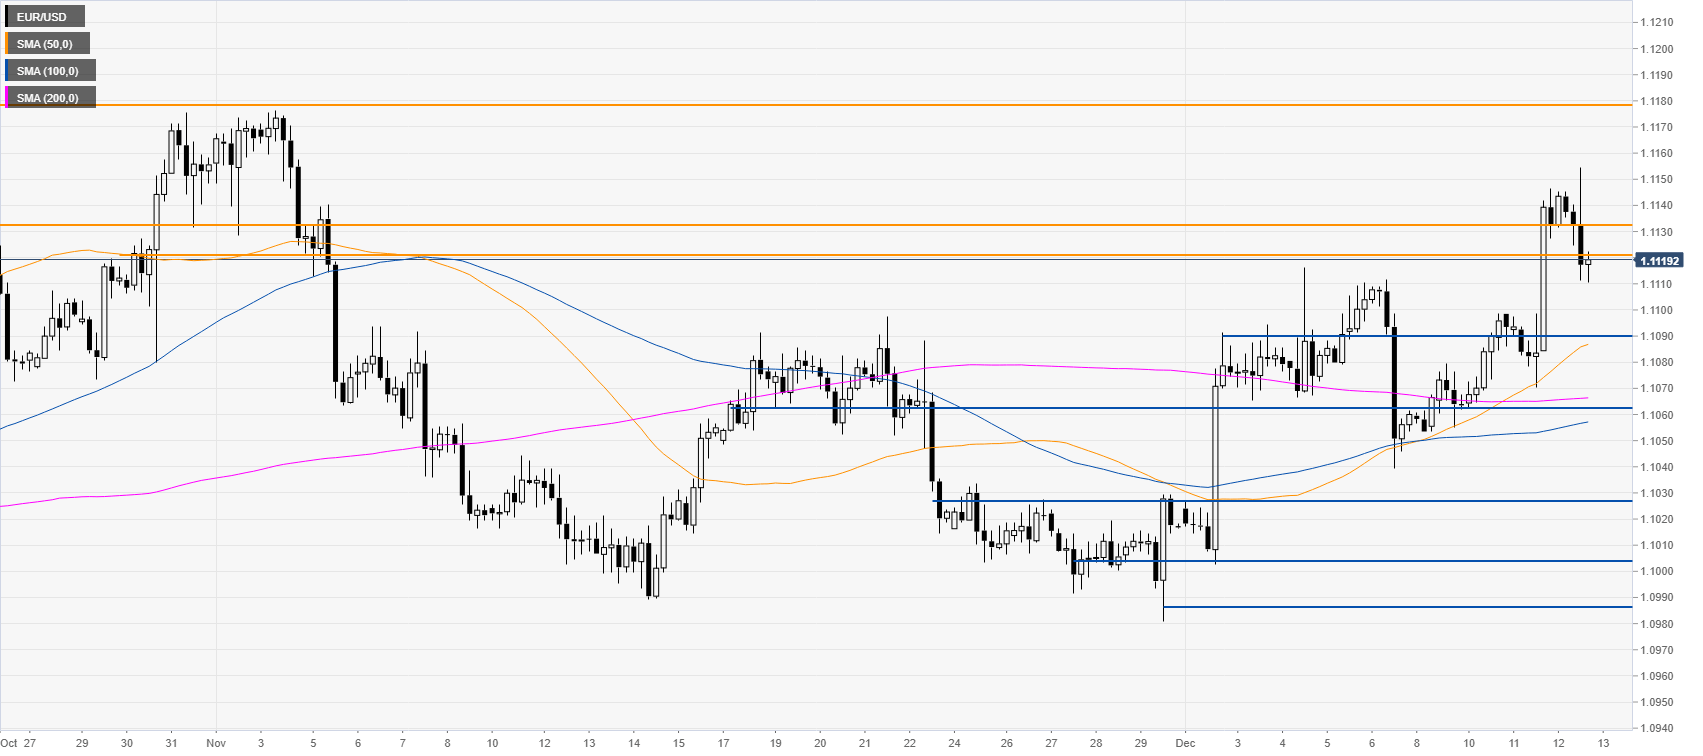
EUR/USD four-hour chart
EUR/USD is trading above the main SMAs suggesting bullish momentum in the medium term. The market is pulling back down from the 1.1120/32 resistance zone. Bulls remain in control but they will need to overcome the 1.1120/32 hurdle to travel north towards the 1.1178 resistance, according to the Technical Confluences Indicator.
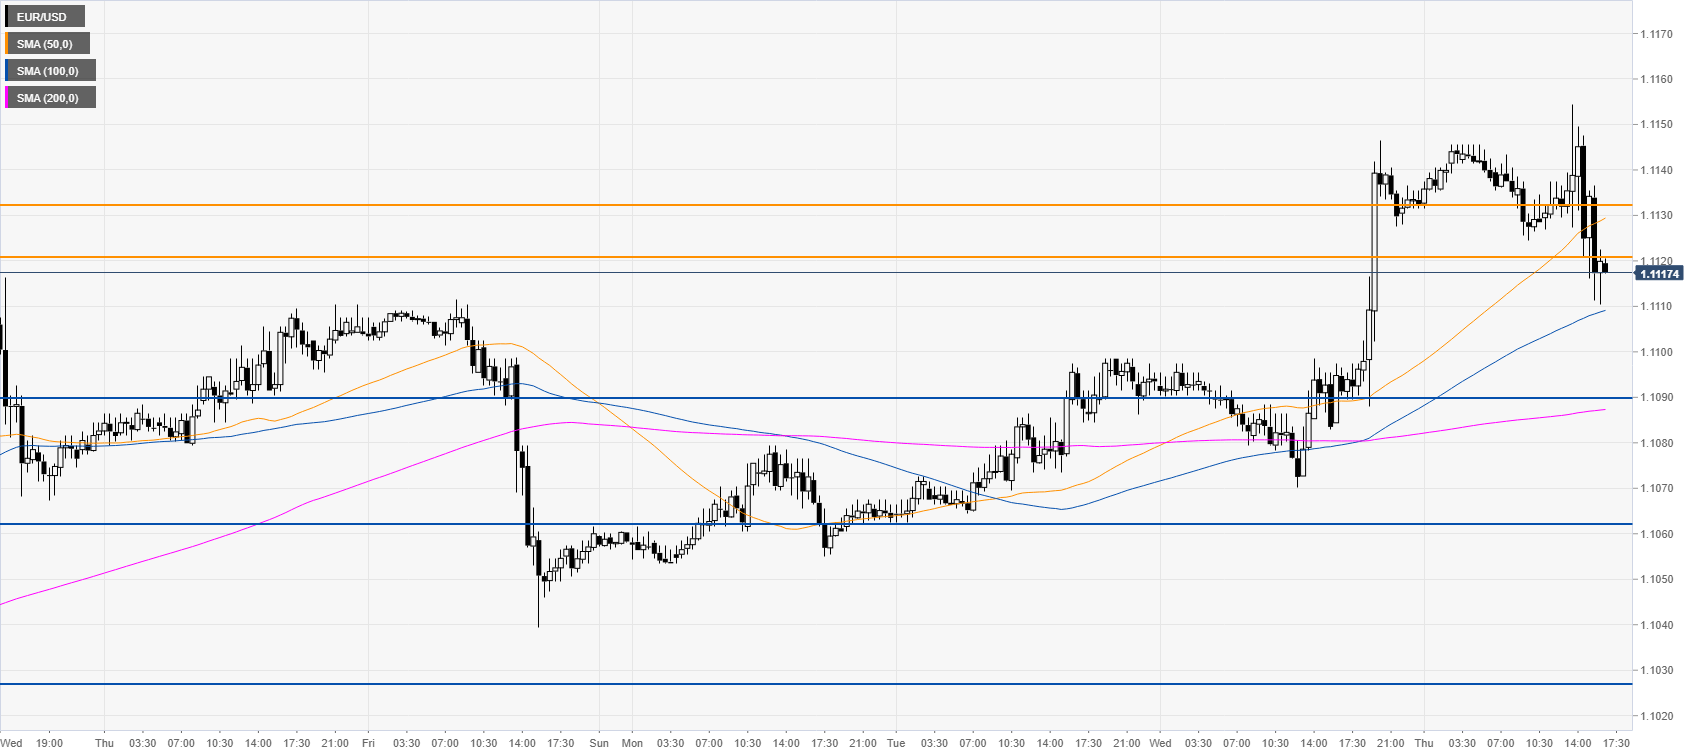
EUR/USD 30-minute chart
The euro is trading above the 100 and 200 SMAs while keeping a bullish bias in the near term. Support is seen at the 1.1090, 1.1062 and 1.1027 price levels, according to the Technical Confluences Indicator.
Additional key levels


