
- IOT/USD went up from $0.16 to $0.164 this Thursday.
- The Elliott Oscillator has had nine straight red sessions of increasing intensity.
IOT/USD daily chart
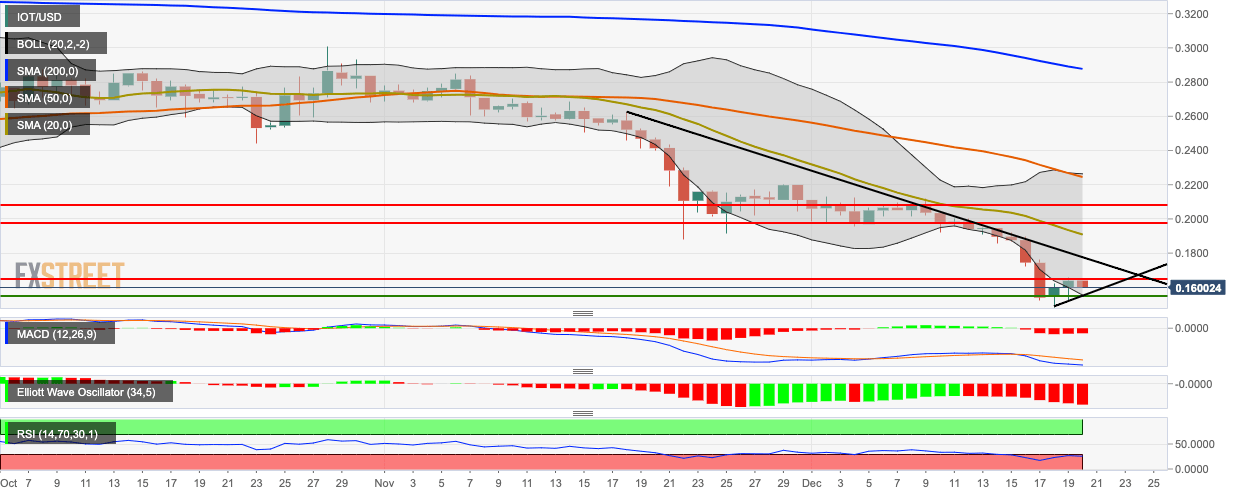
This Thursday, IOT/USD went up from $0.16 to $0.164 and has gone back down to the $0.16-level this Friday. The price is trending within a triangular pattern and hovering below the 200-day Simple Moving Average (SMA 200), SMA 50 and SMA 20 curves. The Eliott Oscillator has had nine straight red sessions of increasing intensity while Moving Average Convergence/Divergence (MACD) indicates increasing bearish momentum. The Relative Strength Index (RSI) is trending around 27 within the oversold zone, so an upcoming bullish correction maybe expected.


