
- DXY is showing signs of bullish interest while off the December lows, but it is still below the 200 DMA.
- The level to beat for buyers is the 97.55 resistance.
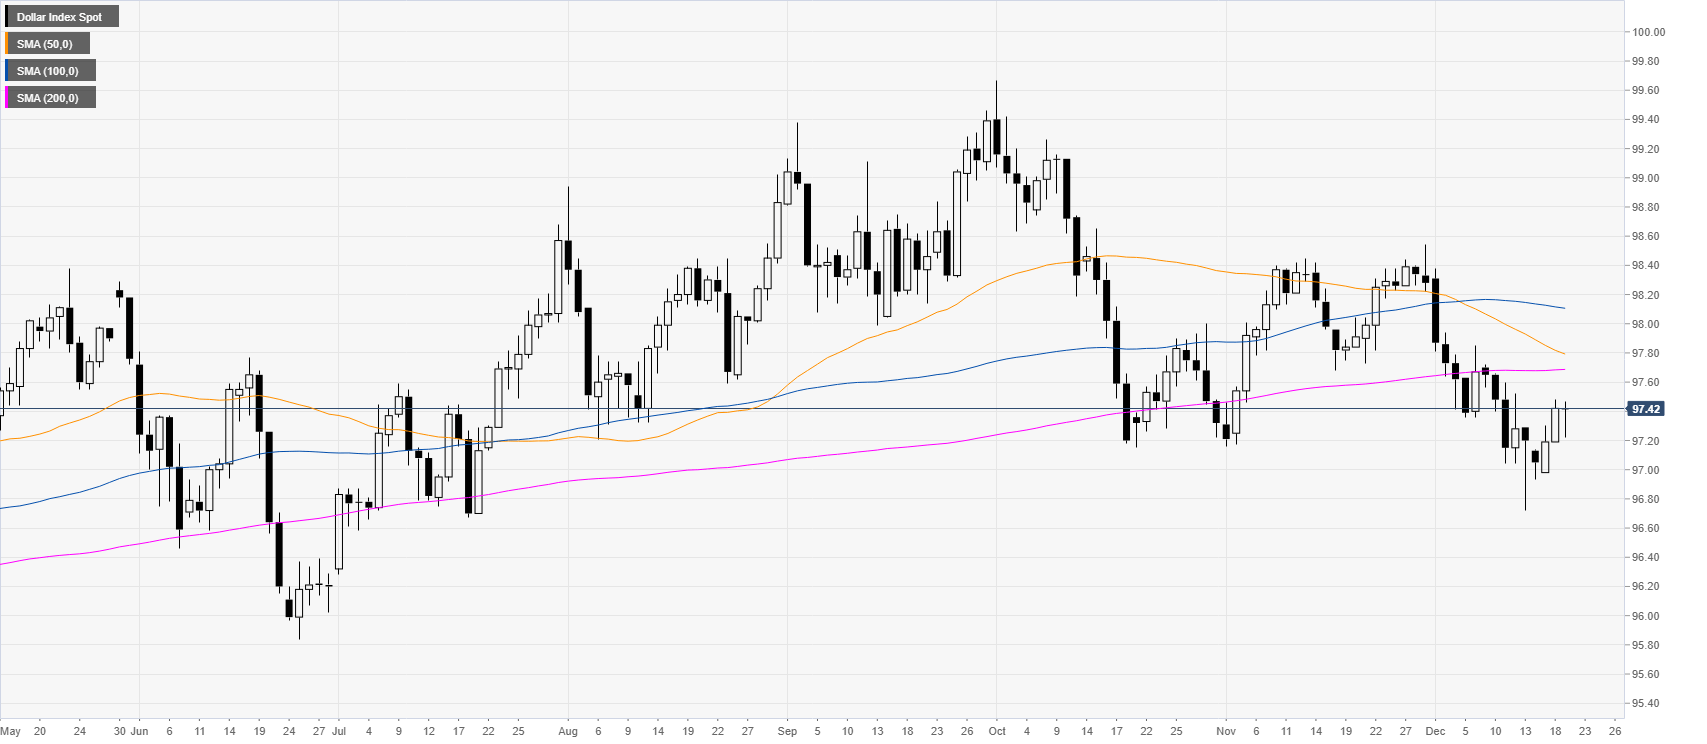
DXY daily chart
DXY (US Dollar Index) is trading off the December lows, however still trading under the critical 200-day simple moving average (DMA).
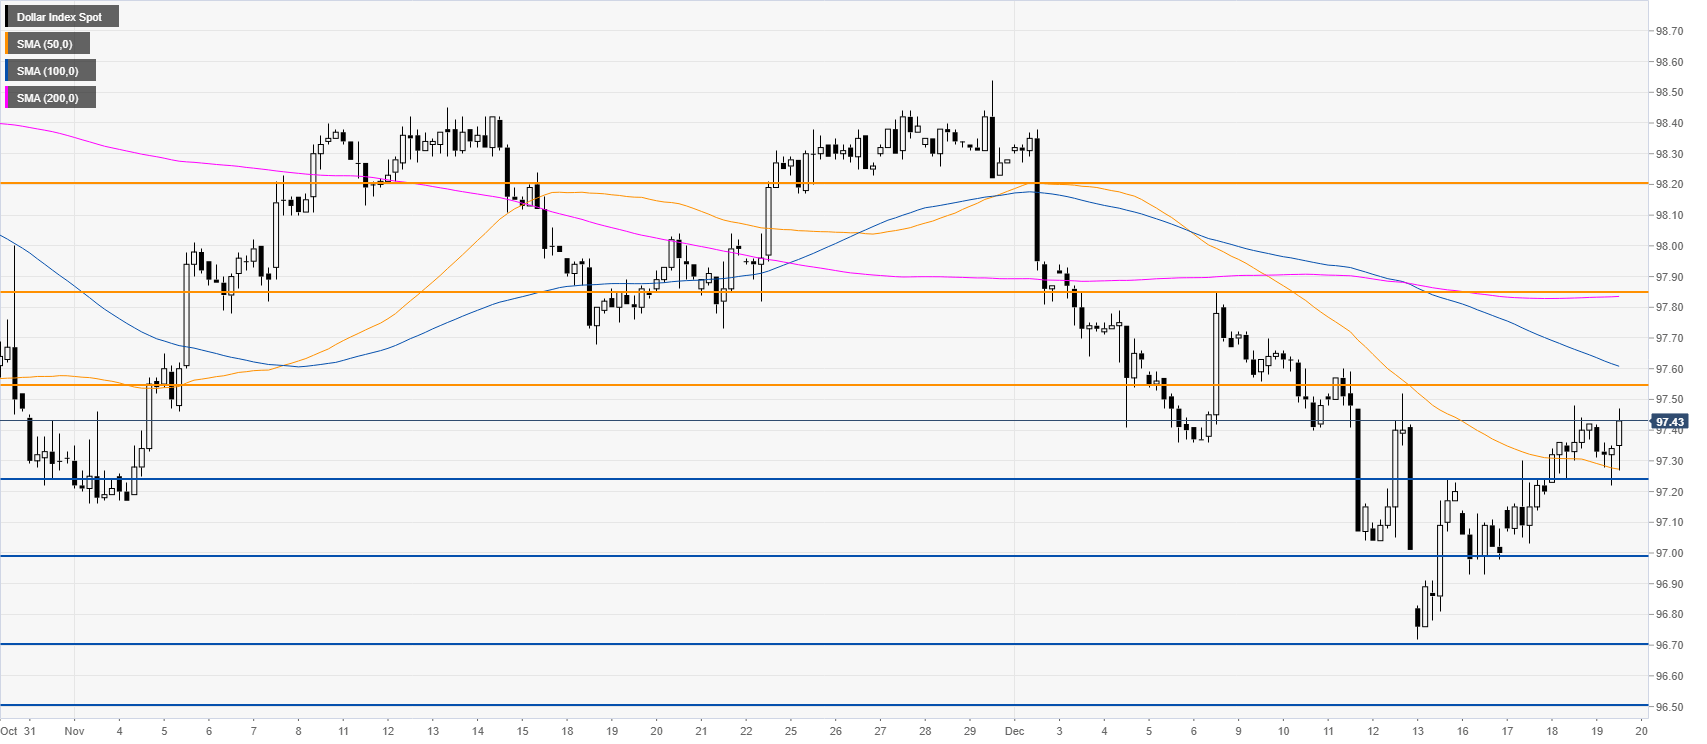
DXY four-hour chart
The market is consolidating the modest advance from the December lows. Bulls are looking for a clear break above the 97.55 resistance to open the way for a potential run to the 97.85 level. On the flip side, support can be located at 97.25 and the 97.00 handle.
Additional key level


