
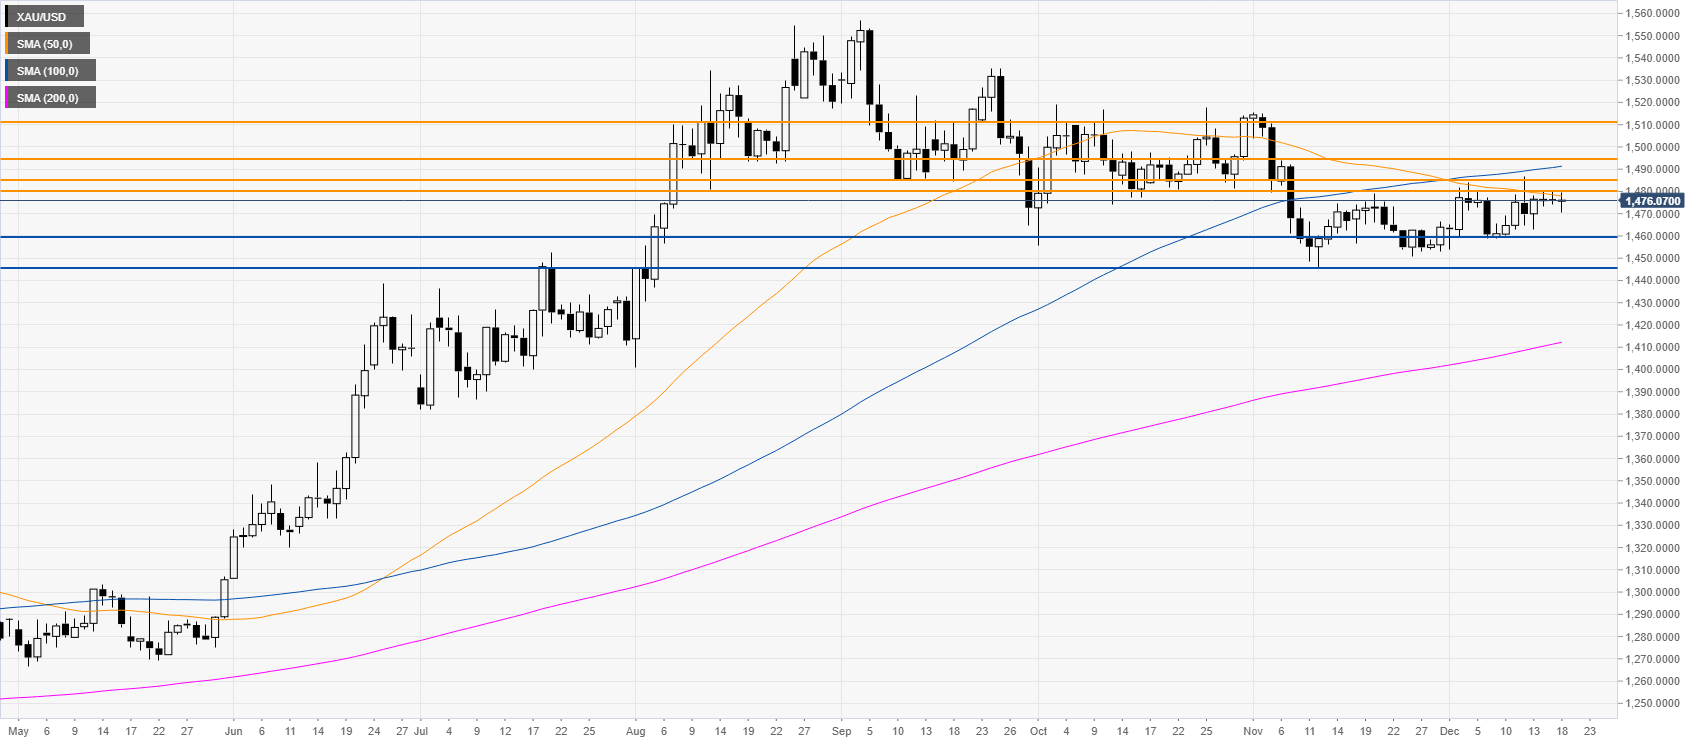
- Gold remains confined in a sideways market in December 2019.
- The level to beat for bulls is the 1480/85 resistance zone.
- Looking down, support is seen at the 1460/50 price zone.
Gold daily chart
The yellow metal has been trading in an unusual tight trading range for the third consecutive day just below the 1480 resistance and the 50-day simple moving averages (DMAs).
Gold four-hour chart
XAU/USD is chopping below the 1480/85 resistance zone while above the main SMAs on the four-hour chart. The bulls are likely waiting for a reason to break above the 1480/85 resistance zone. In case the breakout has follow-through, the next resistances could be located near the 1494 and 1510 levels. On the flip side, if the sellers take over and fade 1480/85, XAU/USD could decline towards the 1460/50 support zone.
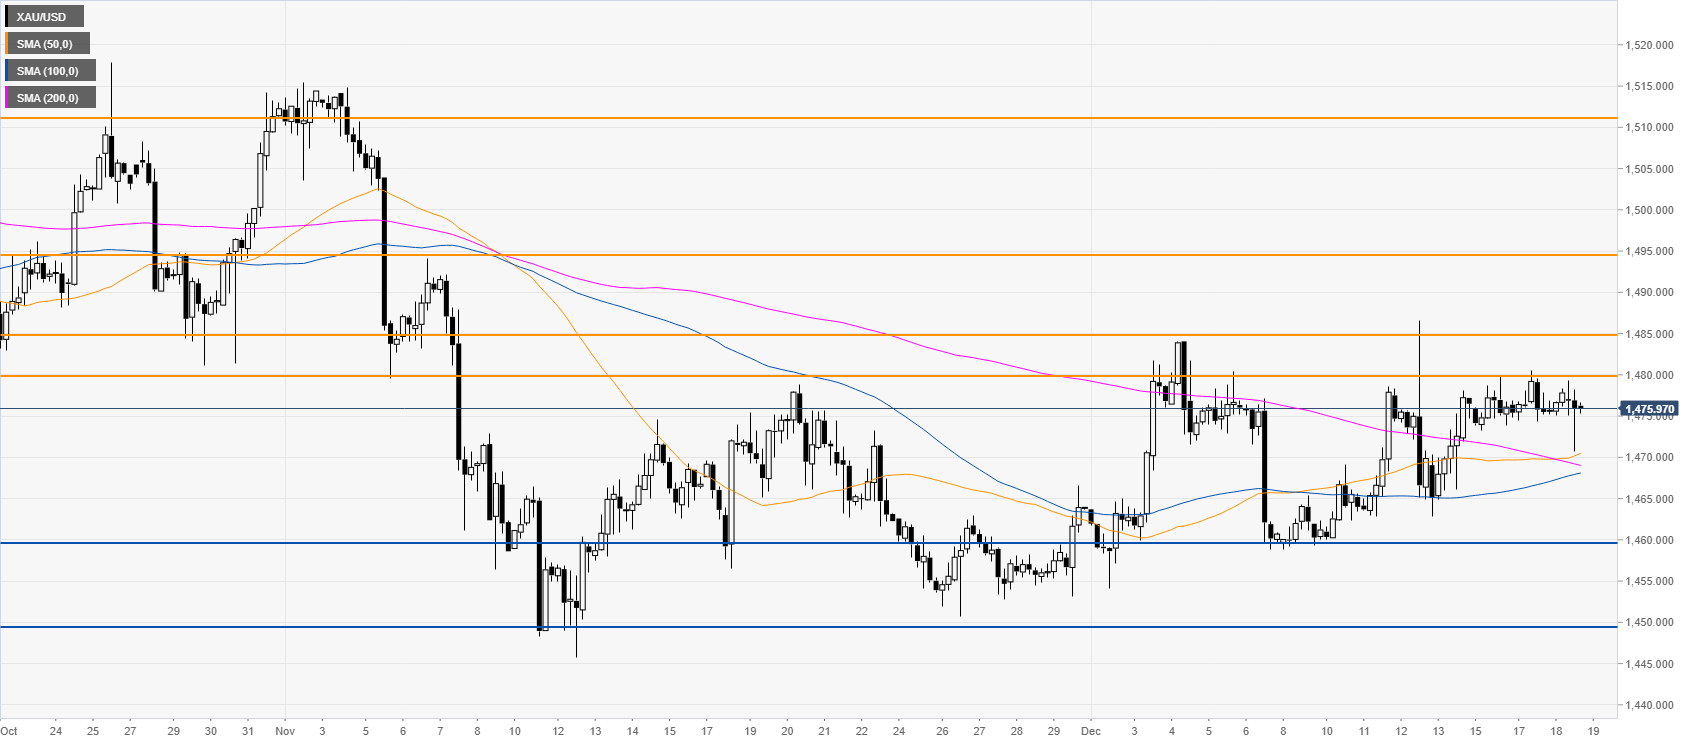
Additional key levels


