
- BCH/USD went up from $176.50 to $189 this Wednesday.
- The RSI indicator is hovering around 35.60.
BCH/USD daily chart
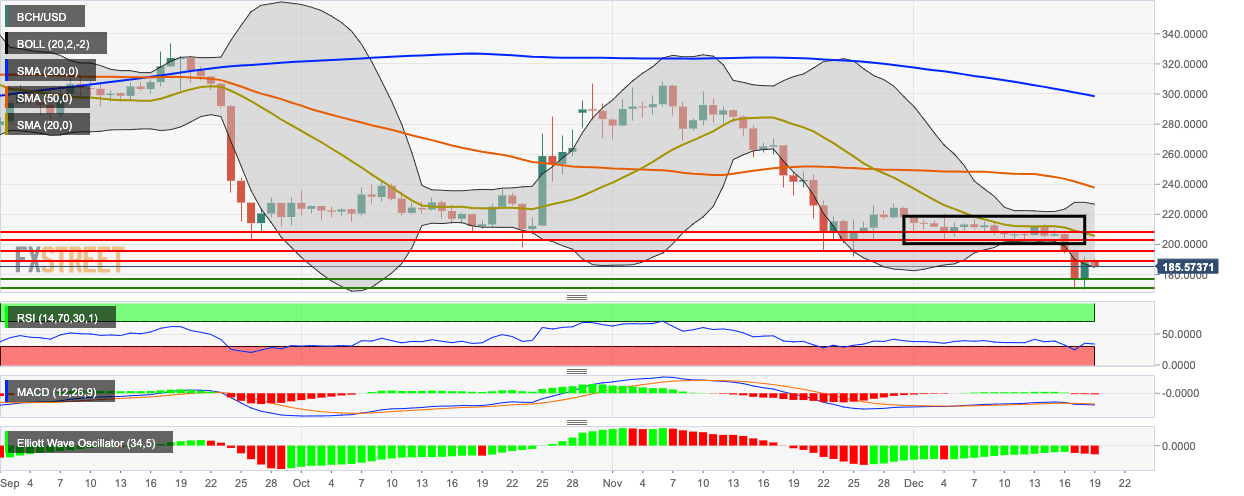
Bitcoin Cash had a hugely bullish day wherein it went up from $176.50 to $189 this Wednesday, going back inside the 20-day Bollinger Band in the process. After running out of steam at the $189 resistance line, the price fell to $185.70. The price has since dropped to $185.65 and is sitting on top of the lower curve of the Bollinger band. The Elliott Oscillator has had three straight red sessions, while the Moving Average Convergence/Divergence (MACD) indicates slight bearish momentum. The Relative Strength Index (RSI) indicator is hovering around 35.60.


