
- EUR/USD bulls are losing steam below the 200 DMA.
- The level to beat for sellers is the 1.1102 support.
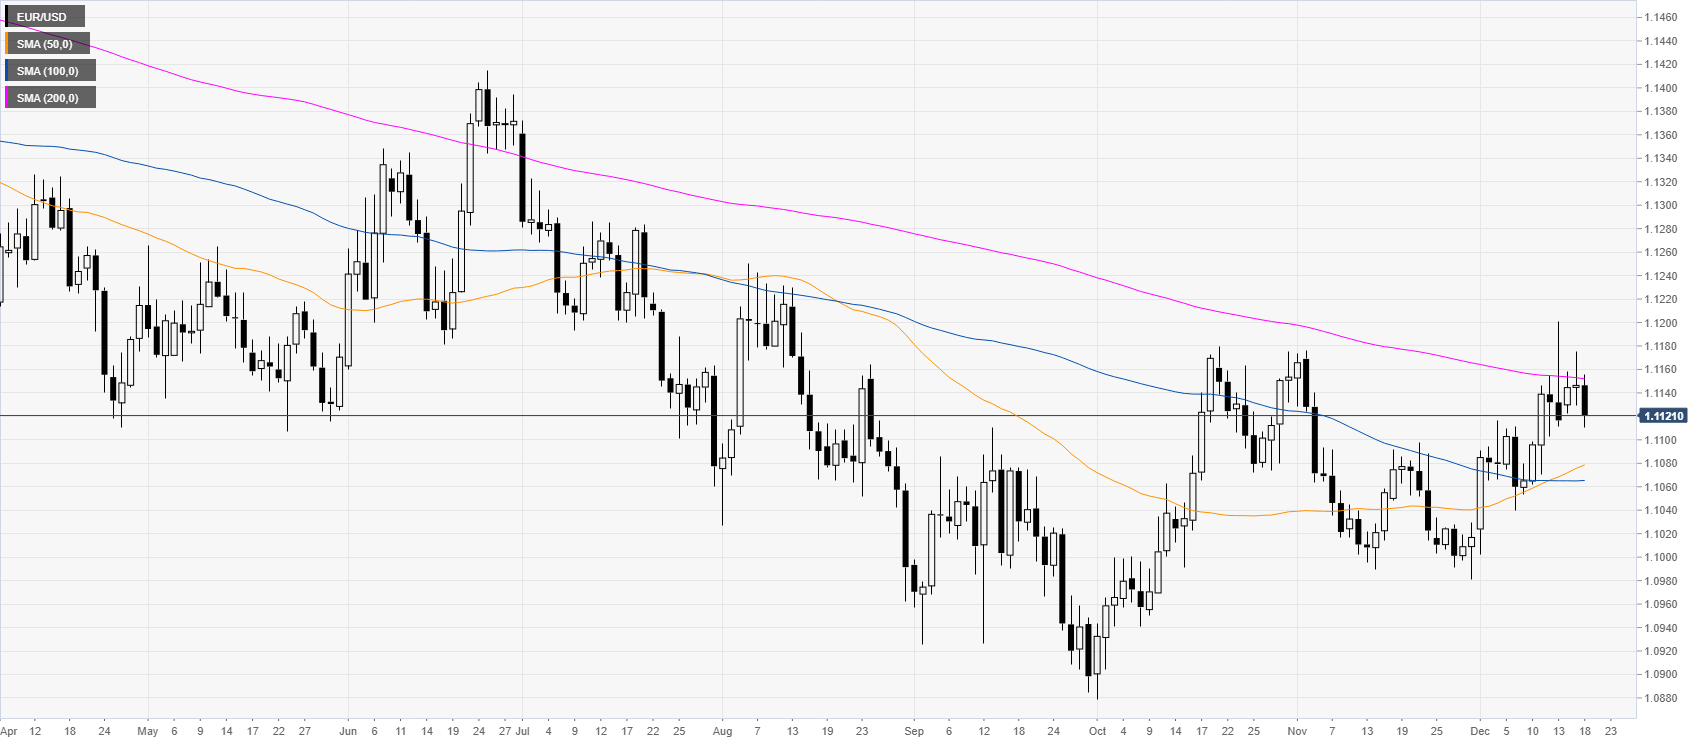
EUR/USD daily chart
Euro bulls are hesitating below the 1.1183/1.1200 resistance zone and the 200-day simple moving average (DMA). The market hasn’t managed to have a close above the 200 DMA since June 2019.
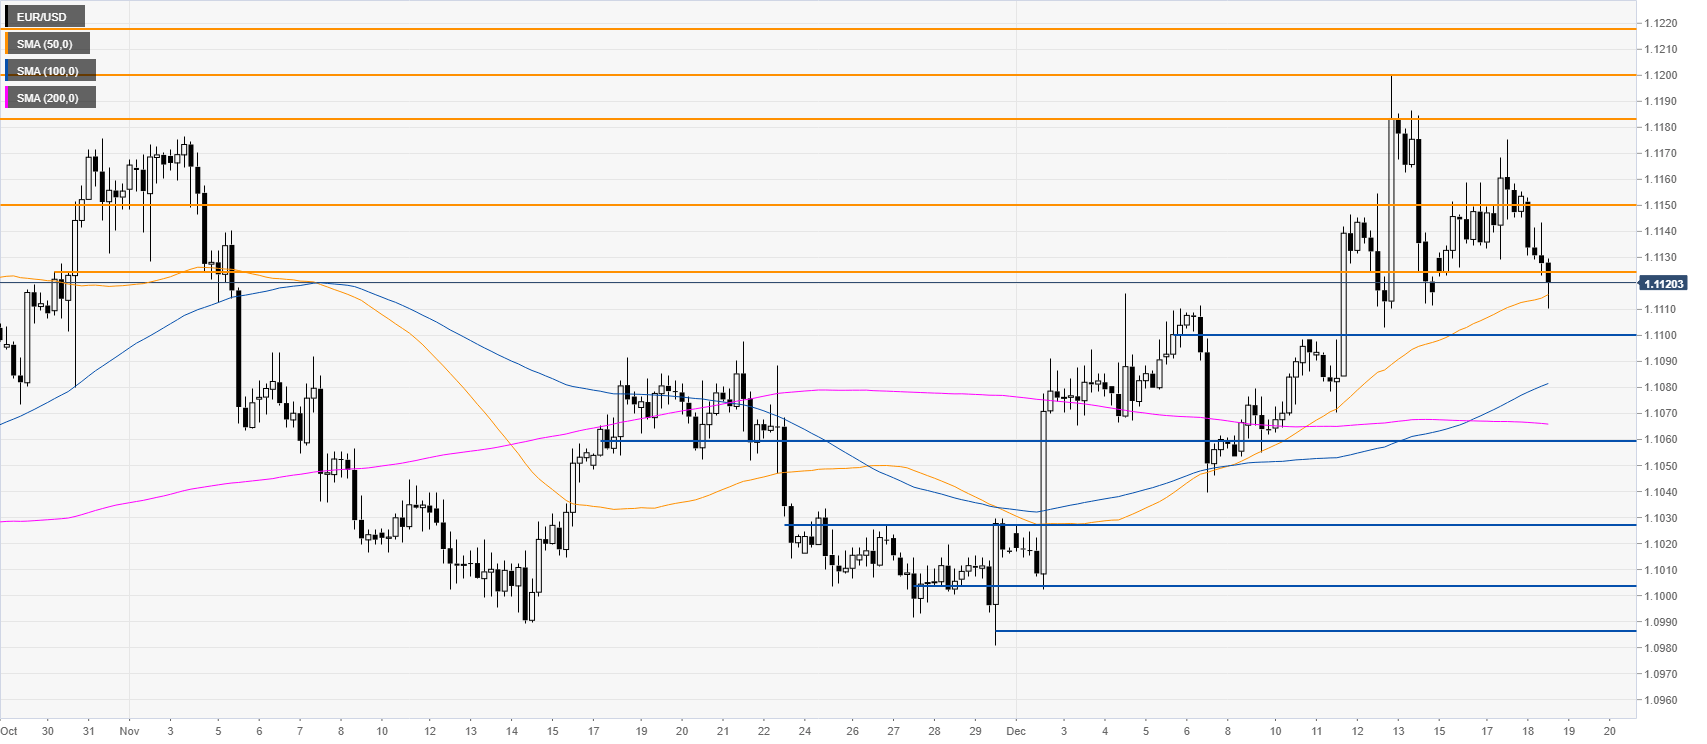
EUR/USD four-hour chart
The spot printed a head-and-shoulders pattern, which is weighing on the euro. Sellers are challenging the 1.1125 level and the 50 SMA on the four-hour chart. As the spot is losing steam, a break below the 1.1102 support can yield further weakness towards the 1.1060 level, according to the Technical Confluences Indicator. Meanwhile, resistance is seen at 1.1150 and 1.1183/1.1200 price zone.
Additional key levels


