
Stellar Price Analysis – December 13
Stellar is currently in a sideways trend between the levels of $0.052 and $0.090. The breakdown or break out of this level will determine the direction of XLM. In the case of XLM/BTC, the coin is in a sideways trend at the bottom of the chart.
XLM/USD Market
Key Levels:
Resistance Levels: $0.09, $0.10, $0.11
Support Levels: $0.060, $0.050, $0.040
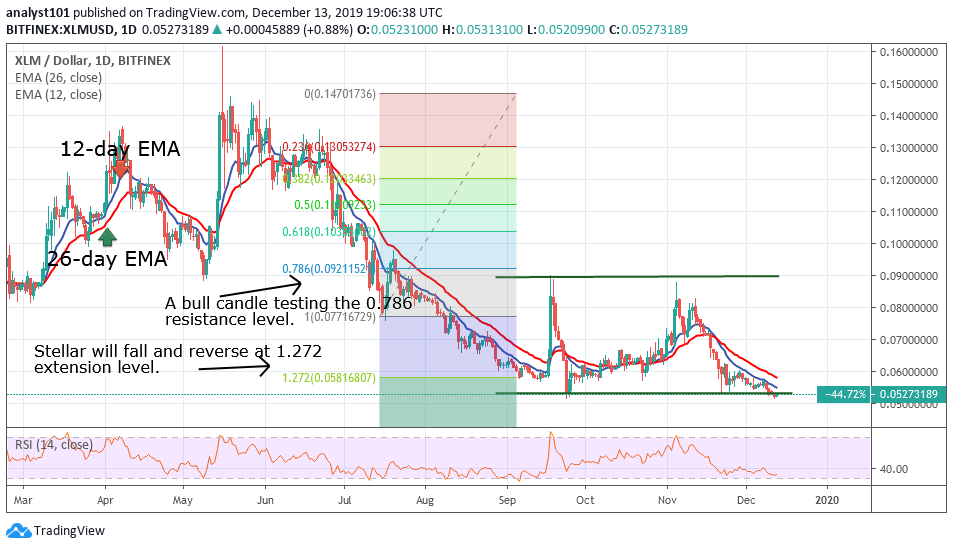
On September 15, Stellar had a bearish run that terminated at the $0.060 price level. In September, the price corrected upward but was resisted at $0.090 and it fell to the same low. In November, the bulls retested the resistance at $0.090 and the coin fell again. Stellar has formed a range between the levels of $0.060 and $0.090.
The downtrend will continue if the bears break the low of $0.060. On the other hand, the coin will be out of the downtrend zone, if the bulls break the resistance at $0.090. Meanwhile, the Fibonacci tool has indicated that Stellar will fall and reverse at the low of 1.272 extension level. This is equivalent to the low at $0.060. In addition, the Relative Strength Index period 14 level 34 indicates that the coin is approaching the oversold region.
XLM/BTC Market
On the XLM/BTC chart, the coin was previously in a bear market. The coin is now fluctuating at the bottom of the chart. The market fluctuates between the levels of Ƀ0.00000600 and Ƀ0.00001000.
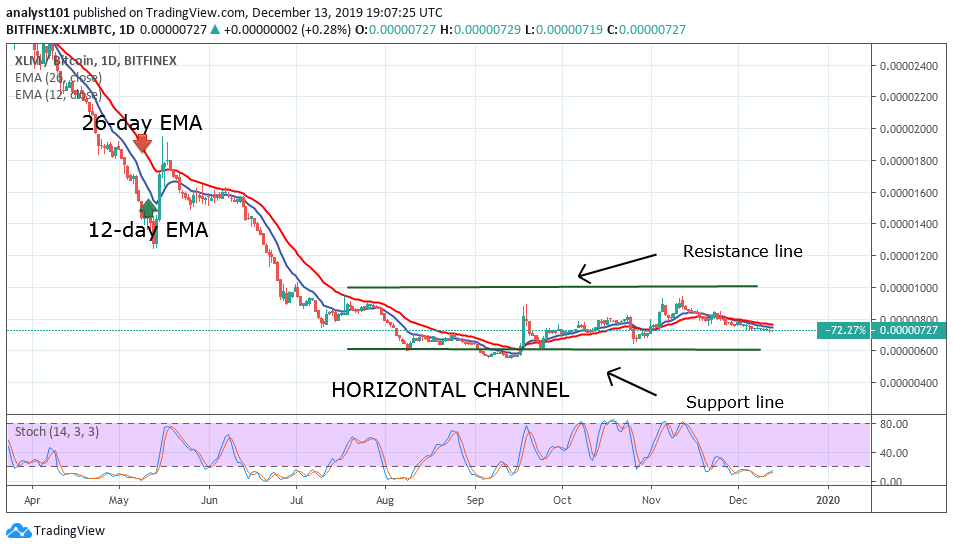
XLM lacks buying power as the bulls could not move up to the resistance line of the horizontal channel. Meanwhile, the coin is trading in the oversold region below 20% range of the daily stochastic. This implies that the market is in a strong bearish momentum.
Please note: Cryptovibes.com is not a financial advisor. Do your research before investing your funds in any financial asset or presented product or event. We are not responsible for your investing results.


