One of the most powerful analytical tools in machine learning and data science in the confusion matrix. The confusion matrix is capable of giving the researchers detailed information about how a machine learning classifier has performed with respect to the target classes in the dataset. A confusion matrix will demonstrate display examples that have been properly classified against misclassified examples. Let’s take a deeper look at how a confusion matrix is structured and how it can be interpreted.
What Is A Confusion Matrix?
Let’s start by giving a simple definition of a confusion matrix. A confusion matrix is a predictive analytics tool. Specifically, it is a table that displays and compares actual values with the model’s predicted values. Within the context of machine learning, a confusion matrix is utilized as a metric to analyze how a machine learning classifier performed on a dataset. A confusion matrix generates a visualization of metrics like precision, accuracy, specificity, and recall.
The reason that the confusion matrix is particularly useful is that, unlike other types of classification metrics such as simple accuracy, the confusion matrix generates a more complete picture of how a model performed. Only using a metric like accuracy can lead to a situation where the model is completely and consistently misidentifying one class, but it goes unnoticed because on average performance is good. Meanwhile, the confusion matrix gives a comparison of different values like False Negatives, True Negatives, False Positives, and True Positives.
Let’s define the different metrics that a confusion matrix represents.
Recall
Recall is the number of genuinely positive examples divided by the number of false-negative examples and total positive examples. In other words, recall is representative of the proportion of true positive examples that a machine learning model has classified. Recall is given as the percentage of positive examples the model was able to classify out of all the positive examples contained within the dataset. This value may also be referred to as the “hit rate”, and a related value is “sensitivity”, which describes the likelihood of recall, or the rate of genuine positive predictions.
Precision
Like recall, precision is a value that tracks a model’s performance in terms of positive example classification. Unlike recall though, precision is concerned with how many of the examples the model labeled positive were truly positive. In order to calculate this, the number of true positive examples are divided by the number of false-positive examples plus true positives.
To make the distinction between recall and precision clearer, precision aims to figure out the percentage of all examples labeled positive that were truly positive, while recall tracks the percent of all true positive examples that the model could recognize.
Specificity
While recall and precision are values that track positive examples and the true positive rate, specificity quantifies the true negative rate or the number of examples the model defined as negative that were truly negative. This is calculated by taking the number of examples classified as negative and dividing them by the number of false-positive examples combined with the true negative examples.
Making Sense Of The Confusion Matrix

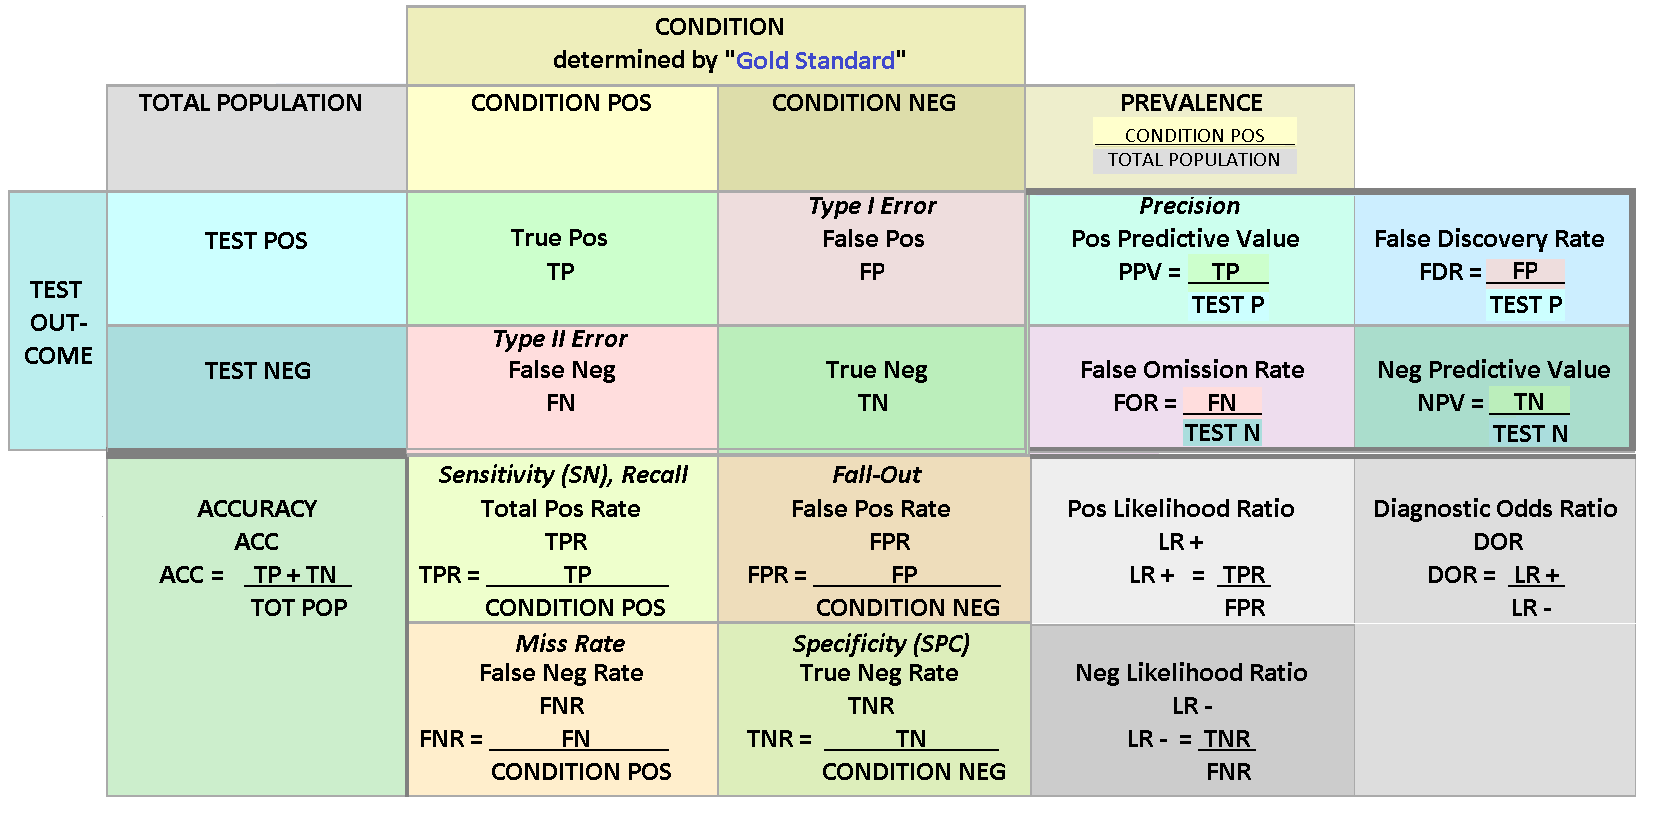
Photo: Jackverr via Wikimedia Commons, (https://commons.wikimedia.org/wiki/File:ConfusionMatrix.png), CC BY SA 3.0
After defining necessary terms like precision, recall, sensitivity, and specificity, we can examine how these different values are represented within a confusion matrix. A confusion matrix is generated in cases of classification, applicable when there are two or more classes. The confusion matrix that is generated can be as tall and wide as is necessary, holding any desired number of classes, but for the purposes of simplicity, we’ll examine a 2 x 2 confusion matrix for a binary classification task.
As an example, assume that a classifier is being used to determine whether or not a patient has a disease. The features will be fed into the classifier, and the classifier will return one of two different classifications – either the patient does not have the disease or they do.
Let’s start with the left-hand side of the matrix. The left side of the confusion matrix represents the predictions that the classifier made for the individual classes. A binary classification task will have two rows here. Regarding the top portion of the matrix, it tracks the true values, the actual class labels, of the data instances.
Interpreting a confusion matrix can be done by examining where the rows and columns intersect. Check the predictions of the model against the true labels of the model. In this case, the True Positives values, the number of correct positive predictions, is located in the upper left corner. The false positives are found in the upper right corner, where the examples are actually negative but the classifier tagged it as positive.
The lower-left corner of the grid displays instances that the classifier has tagged as negative but were genuinely positive. Finally, the lower right corner of the confusion matrix is where the True Negative values are found, or where the genuinely false examples are.
When the dataset contains more than two classes, the matrix grows by that many classes. For example, if there are three classes, the matrix will be a 3 x 3 matrix. Regardless of the size of the confusion matrix, the method for interpreting them is exactly the same. The left-hand side contains the predicted values and the actual class labels run across the top. The instances that the classifier has correctly predicted run diagonally from the top-left to the bottom-right. By looking at the matrix you can discern the four predictive metrics discussed above.
For instance, you can calculate recall by taking the true positives and false negatives, adding them together, and dividing them by the number of true positive examples. Meanwhile, precision can be calculated by combining the false positives with the true positives, then dividing the value into the total number of true positives.
While one could spend time manually calculating metrics such as precision, recall, and specificity, these metrics are so commonly used that most machine learning libraries have methods of displaying them. For example, Scikit-learn for Python has a function generates a confusion matrix.


