Each year as part of The Trek’s annual thru-hiker survey, we ask hikers about the footwear they used, and this footwear data remains my favorite to analyze and write about! I converted from hiking boots to trail runners during my 2014 thru-hike and in the six years since then, the trail runner trend has continued to grow. Some new brands and models have become more popular this year while some consistent favorites are still in the lead. For the details, keep reading, or skip to the TL;DR at the end.
The Hiker Sample
365 hikers participated in the survey, all of whom had walked a section or thru-hike of the AT in 2019. Almost three quarters (70.8%) were thru-hikers and the rest were section hikers. For more details on the hiker demographics, check out our post with general information from the survey.
Footwear Types

More hikers than ever in our surveys (71.8%) started out wearing trail runners and fewer than ever began with hiking boots (16.0%). Ultimately, over three-fourths (77.6%) ended up wearing trail runners and less than a tenth (9.97%) ended up wearing hiking boots. A growing minority of hikers used moderate-support hiking shoes (about 11%, from start to finish) or used minimalist footwear like Chacos (less than 2% at the start and for the duration of the hike).
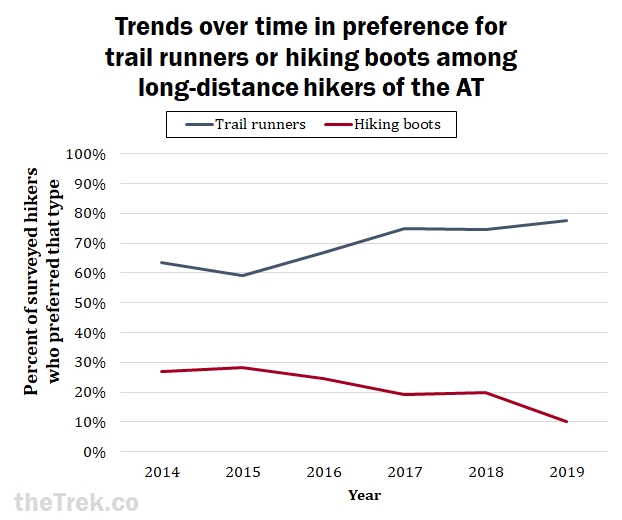
Each year we’ve seen a trend toward more and more hikers opting for trail runners instead of hiking boots. Mid-support, mid-flexibility hiking shoes that are somewhere between boots and trail runners are becoming increasingly common. Any trends regarding minimal shoes (such as Barefoot brand, Crocs, or Chacos) are difficult to detect because such a small percentage of hikers use these shoes in the first place.
Satisfaction
Similar to what we found the past two years, hikers who began with sturdier, heavier footwear were significantly less satisfied than those who began with more lightweight footwear.1
Furthermore, this year, even the hikers who switched pairs and kept using sturdier footwear the whole time were less satisfied than those who switched to lighter footwear by the end. In past years, the hikers who decided to stick with sturdier footwear to the end were pretty satisfied, so I had concluded that this was the best option for some hikers. I don’t want to read too much into this year’s trend, that even those who stick with boots are less satisfied. Still, overall, it’s clear that most thru-hikers will be the most satisfied with lighter footwear.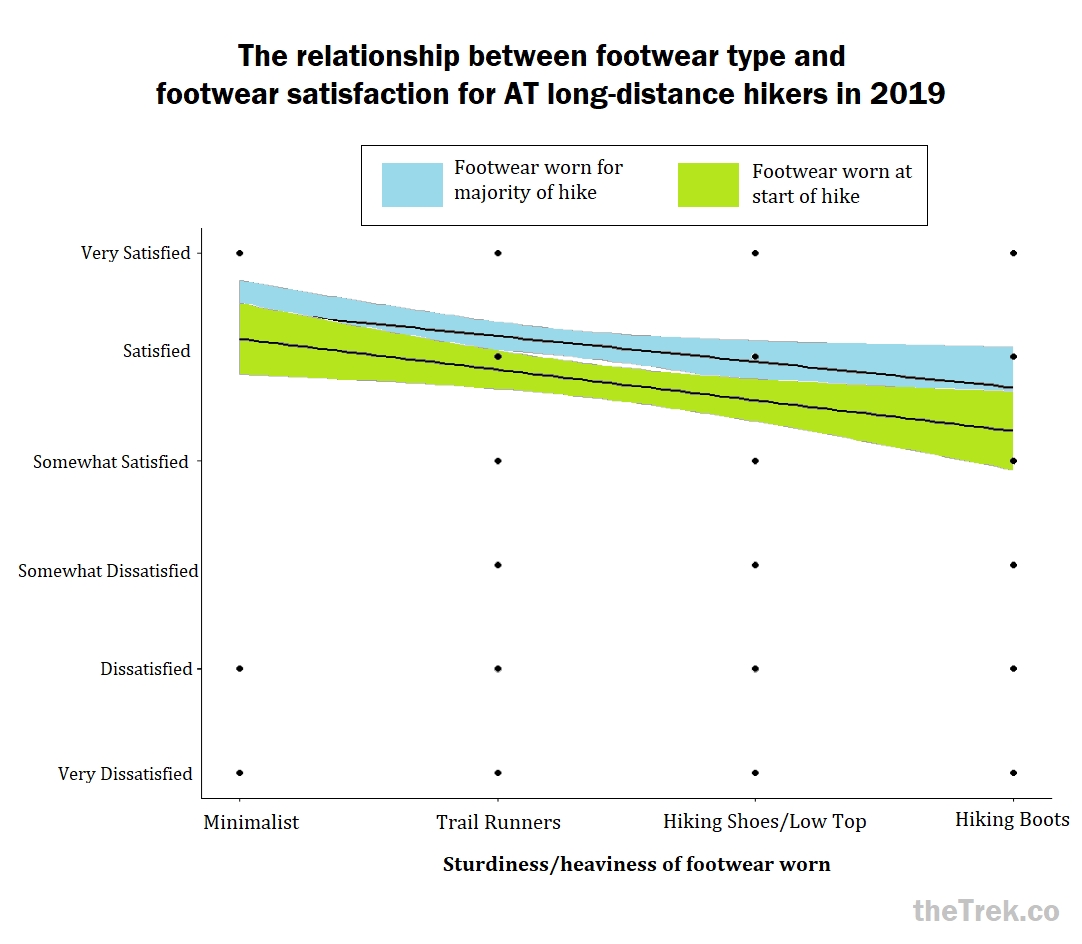
Changes in Footwear Type
In addition to surveying hikers on the footwear they used, I looked into reasons hikers preferred trail runners over hiking boots or shoes. I compiled the reasons they gave for replacing their footwear, and also analyzed what predicted hikers choosing lighter vs. sturdier footwear.
Based on our analysis, hikers’ age, sex, and prior experience do NOT significantly predict preference for wearing lighter-weight shoes for the majority of the hike. Furthermore, going southbound, northbound, or flip-flopping didn’t significantly change a hiker’s likelihood of preferring lighter, less supportive shoes.
The only significant predictor of switching to lighter shoes was hiking farther on the AT that year. The link between farther distance hiked and lighter footwear choice could mean two things. First, this could mean that people who hiked farther decided to wear lighter shoes. Second, it could also mean that their footwear choice helped them succeed in hiking farther, or both.2
Replacements
We looked at whether age, sex, distance hiked, average miles hiked per day, type of footwear initially worn, and satisfaction with initial footwear as predictors of how many pairs of shoes a hiker went through on the AT. Unsurprisingly, hiking a longer distance significantly predicted how many pairs of shoes hikers went through. Accounting for distance hiked, hikers made more footwear replacements if they started with lighter footwear, and if they were less satisfied with their initial footwear.3
We also asked hikers directly what their reasons were for replacing their footwear. These were their responses:
About 23 percent of hikers had some sort of issues with their initial footwear, while the vast majority of replacements were simply because hikers wore through their shoes. Some hikers specified that their shoes didn’t wear out, they just changed pairs after 300-500 miles in accord with the conventional advice to replace boots and running shoes about every 500 miles.
On average, hikers went through three to four pairs of shoes (3.5 pairs). Looking at thru-hikers only, the average number of pairs of shoes worn was still three to four (3.9 pairs).
Top Brands and Models
We asked hikers their favorite brands and series/models of footwear and socks. If they said they disliked every pair, their responses were removed before ranking the top brands and models. The count of how many surveyed hikers named this brand or model as a favorite is in parentheses. The most popular model overall, Altra Lone Peak, was worn by almost a third (27%) of the hikers in the survey.
Many hikers do not remember the exact model even if they loved the brand. So the top seven brands are listed below, with the most popular model or models from that brand.
1) Altra (139 hikers’ favorite)

2) Salomon (60)

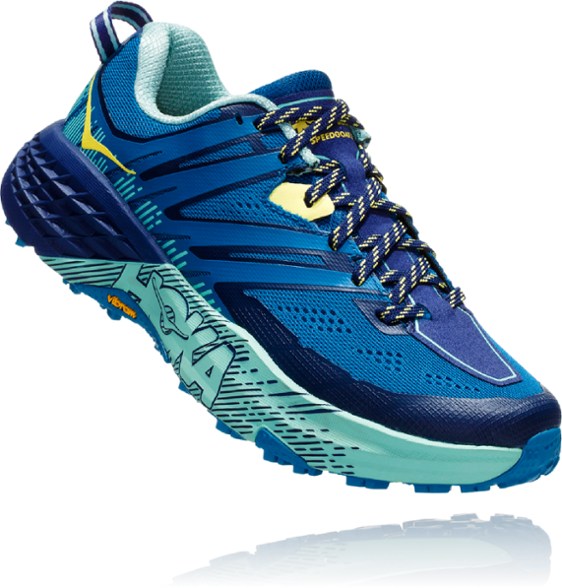
3) HOKA ONE ONE (35)
4) Brooks (25)

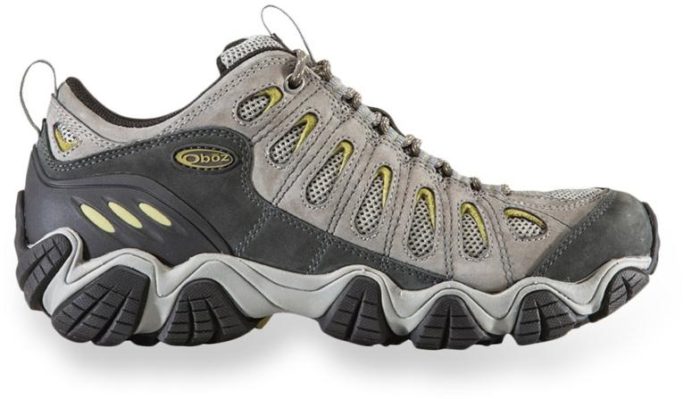
5) Oboz (22)
6) Merrell (20)

7) La Sportiva

Socks
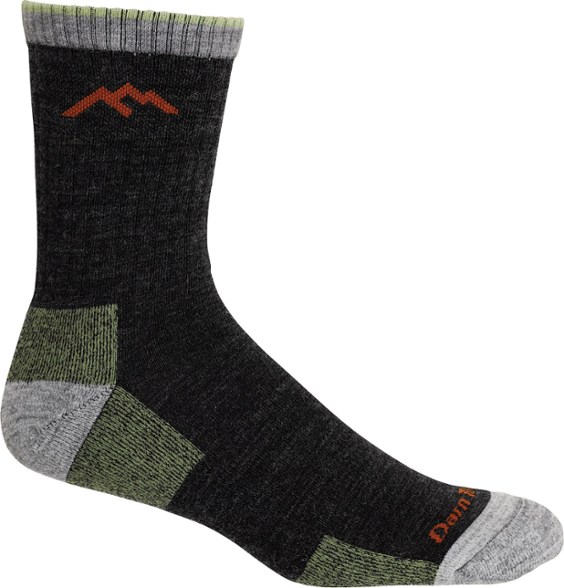
By far the most popular brand of socks worn by long-distance hikers was Darn Tough, worn by two thirds (67.7%) of hikers. Darn Tough provides a lifetime warranty, meaning they will replace any pair if you mail them the old pair. (When I thru-hiked one of my friends had the brilliance to buy all matching Darn Tough socks so they could send them back in pairs, even if a few socks went missing).
-
Darn Tough (241)
-
Injinji (44)
-
Smartwool (34)
-
Farm to Feet (12)
Very few people remembered sock models, and there are so many of them, that this information was not possible to report.
TL;DR
- Each year, a higher percentage of hikers have opted to wear trail runners for the majority of the hike, rather than heavier, sturdier boots or shoes
- While boots may still be preferable during the snowy sections, we recommend that hikers planning thrus or long sections should consider lightweight, more flexible shoes for the majority of their hikes.
- In general, thru-hikers should plan to go through 3 to 4 pairs of shoes.
- Salomon remains the most popular brand for hiking boots among AT long-distance hikers, while Altra has maintained its lead from last year as the most popular brand for trail runners.
- The Altra Lone Peak series were the most popular models for trail runners and the most popular of all footwear.
- Darn Tough, Injinji, and Smartwool socks were all well represented on the AT but Darn Tough were by far the most popular socks.
Many thanks!
Many thanks to the hikers who participated in the survey! Congratulations to you all! I’m so grateful to Zach Davis and Maggie Slepian for getting the survey out and for their edits.
More from the Hiker Survey
Check out our previous post with general hiker information. Upcoming posts from this year’s survey will cover tents and hammocks, backpacks, sleeping bags and pads, and stoves/food/water. To stay updated on the subsequent hiker survey posts, subscribe to The Trek newsletter.
Notes for the Nerds
- For starting footwear type and satisfaction, Pearson’s r = -.14, p = .007. For majority footwear type and satisfaction, Pearson’s r = -.13, p = .021.
- A multivariate linear regression was conducted predicting type of footwear worn for the majority of the hike. Age, sex, prior experience, and direction of the hike were entered in Block 1. Distance hiked was entered in Block 2. The first model was not significant but the second was (Adjusted R2 = .032, F = 2.862, df = 5 and 278, p = .015). In model 2, distance hiked was significant predictor of type of footwear (b = -0.0003, t(278) = -2.918, p = .004).
- A multivariate linear regression was conducted predicting number of pairs of shoes worn. Predicting variables were age, sex, distance hiked, average miles hiked per day, type of footwear initially worn, and satisfaction with initial footwear. The overall model was significant (Adjusted R2 = 0.532, F = 63.82, df = 6 and 326, p < .001) Distance hiked (b = 0.0013, t(326) = 17.243, p < .001), p = .032), initial footwear type (b = -0.3130, t(326) = -4.624, p < .001), and satisfaction with initial footwear type (b = -0.072, t(326) = -2.323, p = .021) significantly predicted number of footwear replacements.
This website contains affiliate links, which means The Trek may receive a percentage of any product or service you purchase using the links in the articles or advertisements. The buyer pays the same price as they would otherwise, and your purchase helps to support The Trek’s ongoing goal to serve you quality backpacking advice and information. Thanks for your support!
To learn more, please visit the About This Site page.


