

Artificial Intelligence (AI) is no longer just a buzzword but an important part of an organisation’s value chain. Tech giants are pouring in resources and capital to build and achieve state-of-the-art solutions in the AI space for core business functions. This race between tech giants has led to a rise of solutions that has turned AI into a kids playground.
Today AI frameworks are almost accessible to anyone with an internet connection and computer. The frameworks and libraries that have come up in the past years have proven its significance in implementing AI with ease.

Contents
- Introduction To Fastai
- Why is it important?
- Machine Learning with Fastai
- Getting The Dataset
- Installing fastai
- Getting Started With Regression
- Complete Code
Introduction To Fastai
In this article, we will learn about an emerging framework called fastai. Fastai is a deep learning library focused on simplifying the implementation of Deep Learning networks and making it accessible.

The library comes with support for all major ML models such as vision, text, tabular, and collaborative filtering.
Find the official GitHub repository here.
Why is it important?
In the world of Machine Learning, everything is about time and accuracy. The faster a model can generate close to accurate results, the better it is. Optimising a Machine Learning model to produce accurate results fast is not an easy task. This is where frameworks play a big role. The objective of any ML framework is simplicity in implementation and optimization. Fastai proves to have both of these qualities.
In the following section, we will see how fastai can produce impressive results without the need for extensive tuning or optimization.
Machine Learning with Fastai
Getting The Dataset
For this illustration, I am using MachineHack’s Predicting The Costs Of Used Cars Hackathon dataset. Head to www.machinehack.com and sign up for the hackathon to download the datasets.
Installing fastai
To install fastai, type and enter pip install fastai on your command line. If you are using conda distribution, use conda activate to activate the environment before installing fastai library or type and enter conda install -c pytorch -c fastai fastai
For more information, visit the official github page here.
Getting Started With Regression
Regression With Fast.ai in 7 simple steps:
- Importing the libraries
- Creating a TabularList
- Initialising Neural Network
- Training the model
- Evaluating the model
- A simple analysis on the predictions of the validation set
- Predicting using the network
For the complete code including Data Preprocessing, check the last section of the article.
Step 1. Importing The Libraries
import pandas as pdimport numpy as npfrom fastai.tabular import *
The fastai.tabular package includes all operations required for transforming any tabular data.
Step 2. Creating A TabularList
TabularList creates a list of inputs in items for tabular data. cat_names and cont_names are the names of the categorical and continuous variables respectively. processor will be applied to the inputs or one will be created from the transforms in procs.
The procs argument specifies the kind of transformations that are required for the dataset. In the above code, block the single argument takes cares of all the data preprocessing stages such as filling missing values, encoding categorical features and normalising.
Code Summary:
- Initializing/Setting The parameters for TabularList such as path, dep_var, cat_names, cont_names and procs.
- Setting the index for the Validation set. The start index and End index are set in such a way that it takes the last 20% data from the training set for validation.
- Creating TabularList for Validation set from train_data.
- Creating TabularList for Test set from test_data.
- Creating a DataBunch for the network.DataBunch is a class that binds train_dl,valid_dl and test_dl in a data object.
#Display the data batchdata.show_batch(rows = 10)
The above code block displays a batch of processed data from the Databunch. See the output below.

Step 3. Initialising Neural Network
#Initializing the networklearn = tabular_learner(data, layers=[300,200, 100, 50], metrics= [rmse,r2_score])
The above line of code will initialize a neural network with 4 layers and the number of nodes in each layer as 300,200, 100 and 50 respectively.
The network will use two primary metrics for evaluation:
- Root Mean Squared Error(RMSE)
- R-Squared
#Show the complete Summary of the modellearn.summary
Output:

Step 4. Training The Model
#Exploring the learning rateslearn.lr_find(start_lr = 1e-05,end_lr = 1e+05, num_it = 100)learn.recorder.plot()
Output:

Learning rate is a hyper-parameter that controls how much the weights of the network is being adjusted with respect to the loss gradient. The lr_find method helps explore the learning rate in a specified range. The graph shows the deviation in loss with respect to the learning rate.
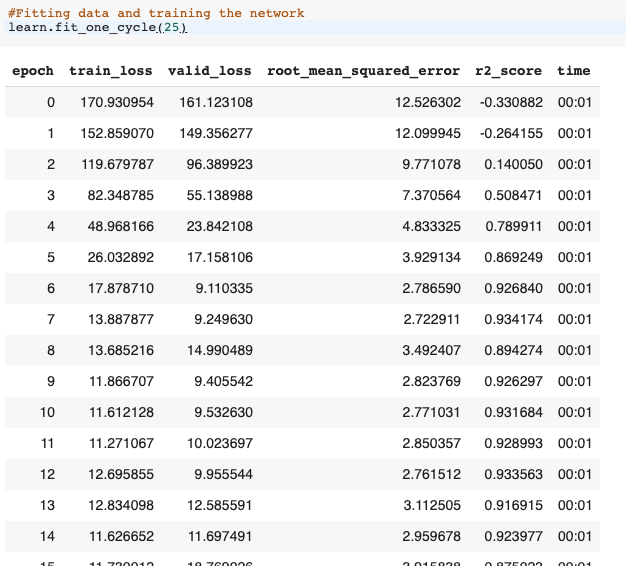
#Fitting data and training the networklearn.fit_one_cycle(25)
The above line trains the network for 25 epochs.
Output:
Step 5. Evaluating The Model
#Display Predictions On Training Datalearn.show_results(ds_type=DatasetType.Train,rows = 5)#Display Predictions On Validation Datalearn.show_results(ds_type=DatasetType.Valid)
The show_results method will display the data bunches along with predicted values. See the output below:

Fetching the Metrics
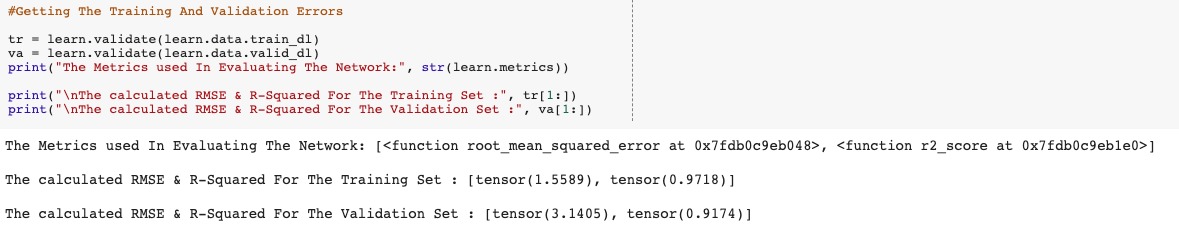
#Getting The Training And Validation Errorstr = learn.validate(learn.data.train_dl)va = learn.validate(learn.data.valid_dl)print("The Metrics used In Evaluating The Network:", str(learn.metrics))print("nThe calculated RMSE & R-Squared For The Training Set :", tr[1:])print("nThe calculated RMSE & R-Squared For The Validation Set :", va[1:])
The code block above will fetch and print the calculated metrics for the training and validation data.
Output:
Summary:
The Root Mean Squared Error is the standard deviation of the errors/residuals. It tells us the ‘Goodness Of Fit’ of a model. The lower the value of RMSE the better the model.

The R-Squared metric also called the coefficient of determination is used to understand the variation in the dependent variable(y) and the independent variable(X).The closer the value of R-Squared is to one, the better the model.
The above output suggests that:
The model/network was able to attain an RMSE of 1.4678 and an R-squared of 0.9726 while training and an RMSE of 3.1737 and an R-squared of 0.9107 while Validating on the validation set.
Potting The Losses
#Plotting The losses for training and validationlearn.recorder.plot_losses()
The above code plots the training and validation losses.
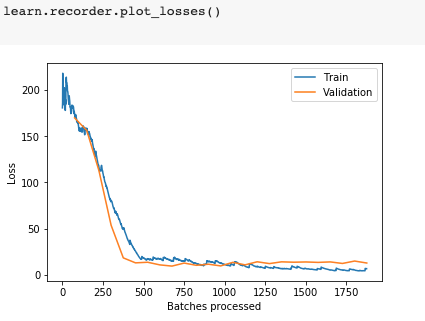
The above graph shows the change in loss during the course of training the network. At the beginning of the training, we can see a high loss value. As the networks learned from the data, the loss started to drop until it could no longer improve during the course of training. The validation shows a relatively consistent and low loss values.
Note :
The validation losses are only calculated once per epoch, whereas training losses are calculated after
Plotting The Learning Rate, Momentum And Metrics
#Plotting Momentum & Learning Ratelearn.recorder.plot_lr(show_moms=True)#Plotting the metrics of evaluationlearn.recorder.plot_metrics()
Output:

Step 6. A Simple Analysis On The Predictions Of Validation Set
#Plotting The Average Price For A Given Car Brand, -- Actual vs Predictedimport matplotlib.pyplot as pltplt.figure(figsize=(30, 3))plt.plot(val.groupby(['Brand']).mean()['Price'], linewidth = 3, )plt.plot(val.groupby(['Brand']).mean()['Predicted'],linewidth = 5, ls = '--')plt.title('Average Price By Brands')plt.xlabel('Brands')plt.ylabel('Price In Lacs')plt.legend()plt.show()
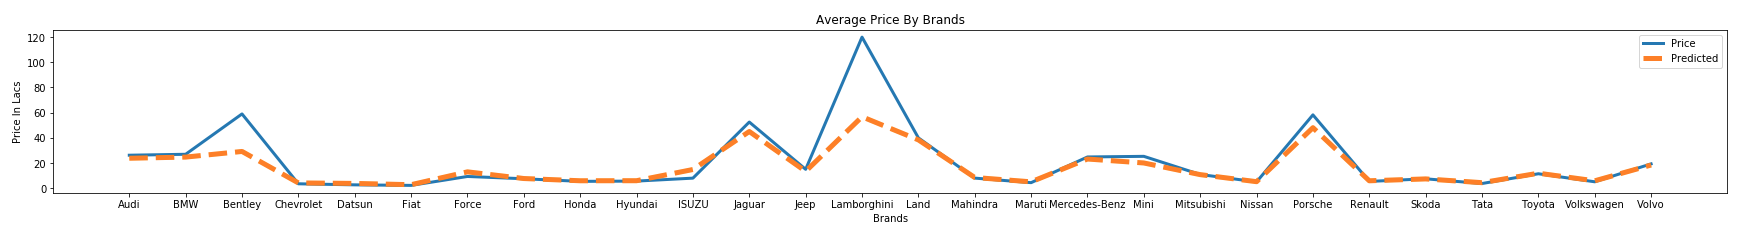
The above graph shows the comparison of the average actual price by Brand and the predicted price.
Step 7. Predicting Using The Network
#Predicting For a single observation#Test set data for row 0test_data.iloc[0]

#Predicting For The Complete Test settest_predictions = learn.get_preds(ds_type=DatasetType.Test)[0]#Converting the tensor output to a list of predicted valuestest_predictions = [i[0] for i in test_predictions.tolist()]#Converting the prediction to . a dataframetest_predictions = pd.DataFrame(test_predictions, columns = ['Price'])#Writing the predictions to an excel file.predictions.to_excel("Fast_ai_solution.xlsx", index = False)
Submit the above file here to find out your score. Good Luck!
Complete Code
Click here for notebook.


