
By: Sam Koslowsky, Senior Analytic Consultant, Harte Hanks
A key metric that marketers track involves customer life time value. With the proliferation of segment managers, and the availability of ‘BIG’ data, there has been an ever-increasing need to both evaluate and model this all-important measure. The old 80/20 (or perhaps 90/10) rule maintains that the preponderance of profit emanates from a few valuable customers. By definition, this implies that the distribution of this profitability yardstick is quite skewed. The graph below better depicts this relationship.
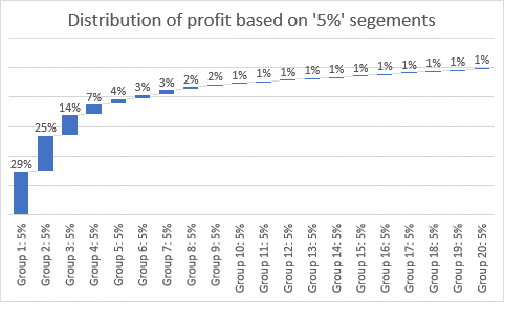
Much of the profit emerges from the top quintile. Little emanates from the bottom 20%. Yet, many analysts, appear to ignore this distortion as they proceed to model customer value. Some might not realize it even exists.
This bias typically results in development of one model where all the predictors are applied evenly to all customers. What is produced is a single model-the ‘mean’ result. It seems to make sense that higher profit customers may very well be influenced by a different dynamic than lower valued ones. How does the marketer deal with this phenomenon?
Analytics provides researchers basic and more advanced approaches to analyze data. In the basic setting, a manager may compute, for example, the average value of age and then associate it with profitability. A simple regression formulation would generate this relationship. While this, so called, average statistic, does provide limited information, it certainly is somewhat deficient.
Imagine a marketing manager that is reviewing his sales trend. He records the following historical values:
A naïve estimate of sales for the next ‘period’ might be derived through a simple linear regression analysis. This would be 6321.75. This prediction does not appear to be especially informative. However, if we construct different ‘cuts’ of the data, say quintiles, we may arrive at a somewhat more useful result. Look at the estimates below.
| PERCENTILE | ESTIMATE |
| 5% | 40.7 |
| 50% | 127.5 |
| 95% | 21274.75 |
As another simple illustration, suppose we learn that customer value (or profitability) increases $4.13 if two or more children are present in the household. Should we be satisfied with that? Is there a way of gaining some more insight? Take a look at the following visual.
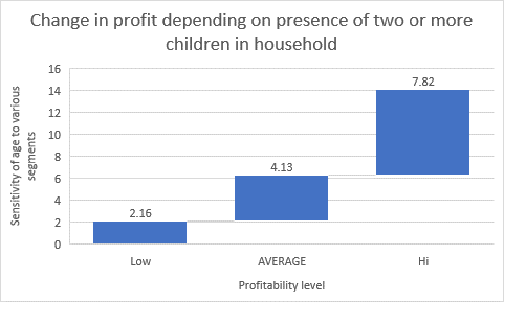
Presence of children plays more of an important role for higher levels of profitability (profitability increases $7.82 for presence of children for high profitability households vs. $2.16 for lower valued ones)!
Analysts typically employ a variety of regression techniques to measure the relationship of customer attributes and socio demographic characteristics with customer value. These are accomplished assuming that the regression coefficients or weights are constant across the population – in other words, the relationships between the dependent variable and the independent variables remain the same across different values of the variables.
Let’s work with a reduced a data set emanating from a large retail chain, that contains customer profitability, along with typical predictors that may be found in a data mart. For the sake of simplicity, the final analysis developed for modeling profitability consists of four YES/NO type variables. These are:
- Marital status
- Investable asset greater than $150k
- Ordered via retailer’s Ecommerce site
- College graduate
The resulting model developed appears below.
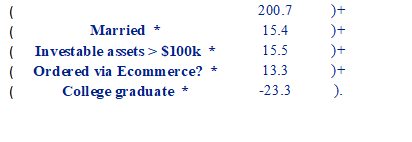 This model gauges how, on average, the above variables, impact customer profitability. For example, the MARRIED variable evaluates the effect of being married vs. being single on customer profitability. Being married adds $15.40 to an individual’s customer value. While the above analysis can shed some light on the question “is being married important?”, it cannot respond to another critical matter: “does being married impact customer profitability more for those with higher profitability than those with average or low profitability? “.
Enter Quantile regression. Quantile regression models the association between a set of predictor variables and specific percentiles (or quantiles) of the dependent variable. It examines changes in the quantiles of the dependent variable. Take the first quintile (20%) of customer profitability. Quantile regression at this level relates customer profitability at the first quintile to our predictors. Don’t get confused. Quantile regression is not a regression estimated on a quantile, or subsample of data as the name may suggest.
Let’s return to the simplified, yet informative, example introduced above. We will invoke the Quantile regression procedure (we’ll get to the various programs that do this a bit later on), and model at the 25th, 50th and 75th percentiles. It is instructive to observe how our coefficients change at each level of analysis. First a table depicting these weights, and then a pictorial view to further highlight the results.
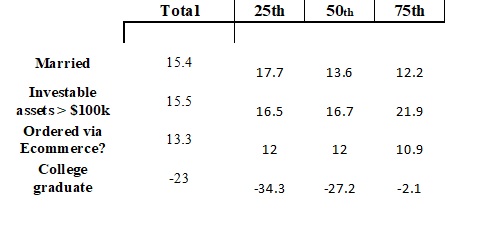 The total column reproduces what we saw above, and would be the typical output available via a linear regression analysis. Quantile regression addresses the issue of whether these coefficients apply equally as well, across all segments. The columns labeled ‘25th’ 50th and 75th contain the coefficients that the Quantile regression generated at that particular level. Let’s examine each variable separately.
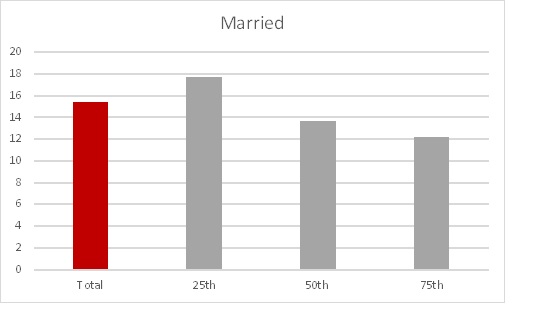 It’s clear from the graph that more profitable customers appear to be less likely to be married, and the pattern is well-defined.
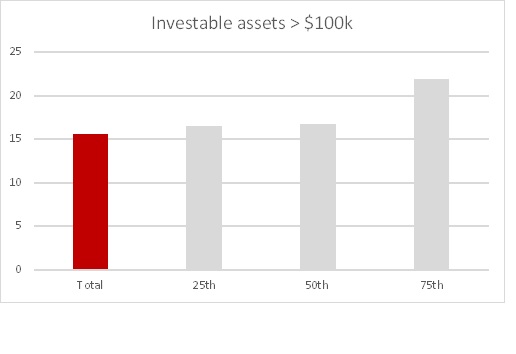 Also, an unambiguous pattern-more profitable customers are associated with this asset level base.
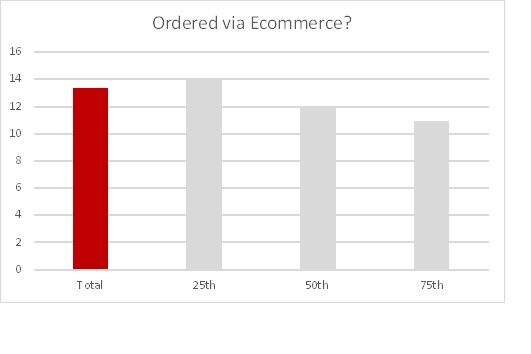 While asomewhat less pronounced, ordering via Ecommerce is more influential for the lower profitability segment.
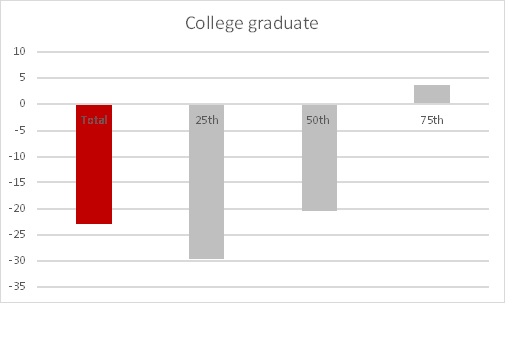 Being a college graduate is telling. Earning your college diploma is ‘good’ for higher profitable customers, and significantly poorer for the lower quantiles.
In case you’ve never used QR (quantile regression), It is supported by a wide variety of procedures. Some of these include:
- R offers several packages that implement quantile regression, most notably quantreg
- SAS through proc quantselect
- Statsmodels package for Python, via QuantReg
- Stata, via the qreg command.
- Matlab function quantreg
- Mathematica package QuantileRegression.m
- SPSS via the R addon Quantile regression
Some of the less know benefits of employing quantile regression include a reduced concern with outlier influences, generally more meaningful analysis, and the ability to discern the diverse effects of predictors at different levels of the dependent variable.
The real significance for marketers is that it presents a more potent approach as we move from a single picture of the universe (ordinary least squares regression) to a more focused view of targeted segments. By analyzing the higher quantile regression model, we can obtain more reliable estimates of profit. And, we have the opportunity to secure the key components required to enhance marketing programs.
And, at the end of the day, that should be our objective-learn more to further improve our marketing campaigns.
About the Author
 Sam Koslowsky serves as Senior Analytic Consultant for Harte Hanks. Sam’s responsibilities include developing quantitative and analytic solutions for a wide variety of firms. Sam is a frequent speaker at industry conferences, a contributor to many analytic related publications, and has taught at Columbia and New York Universities. He has an undergraduate degree in mathematics, an MBA in finance from New York University, and has completed post-graduate work in statistics and operations research.


