We all know that inflation in a game economy can cause a lot of problems. Among which:
- Decreased need to spend money on in-app purchases to obtain game items/currency
- Increased difficulty for new players to be able to compete with older players
- Lack of feeling of meaningful progression
- Overall spender demotivation
This video from Extra Credits is a great resource on inflation and Power Creep
This article is aimed at giving product people the tools needed to monitor inflation, deflation, and equilibria in their games.
High-level tutorial on monitoring game economy inflation
It all starts with good analytics tracking of game metrics. https://andersdrachen.files.wordpress.com/2013/07/02drachenetal02.pdf
In order to monitor inflation, we start by listing the game currencies and items that players can accumulate, for example:
- Gems (hard currency)
- Fairy Dust (soft currency)
We gather these metrics on a database maybe with a structure similar to the one below.
| playerID | current_gems | current_fairydust | gametimestamp |
| lala123 | 1045 | 2000 | 11/10/2019 21:53:36 |
| vivi456 | 24 | 34 | 11/10/2019 21:54:36 |
| lala123 | 500 | 2000 | 11/10/2019 21:55:36 |
The next step is to gather the data in order to analyze inflation. For this step, we query the database where the player data is stored and aggregate the minimum number of gems (or other currency), that the player held during the day. This number gives us a baseline for the lowest amount that the account saw that day. After we aggregate that minimum amount per player per day, it’s time to see what is the average minimum number of gems for that day. The SQL code snippet below can give us an idea of how to accomplish that task.
with pre_select as (
    SELECT DATE_TRUNC('day', gametimestamp) as day,
        playerID,
        MIN(current_gems) as gems,
        MIN(current_fairydust) as fairydust
    FROM game_table
    GROUP BY 1, 2 )
SELECT day,
    AVG(gems) min_gem_inventory,
    AVG(fairydust) min_fairydust
FROM pre_select
GROUP BY 1
ORDER BY 1
After we query our data, the simplest method for product people is to get a CSV and import it to a spreadsheet, like on the sample below.
| day | min_gem_inventory | min_gem_inventory_serie1 | min_gem_inventory_serie2 |
| 01/01/2020 | 23 | 23 | |
| 02/01/2020 | 10 | 10 | |
| 03/01/2020 | 34 | 34 | |
| 04/01/2020 | 36 | 36 | |
| 05/01/2020 | 57 | 57 | |
| 06/01/2020 | 100 | 100 | |
| 07/01/2020 | 250 | 250 | |
| 08/01/2020 | 245 | 245 | |
| 09/01/2020 | 100 | 100 | |
| 10/01/2020 | 400 | 400 | |
| 11/01/2020 | 500 | 500 | |
| 12/01/2020 | 1000 | 1000 |
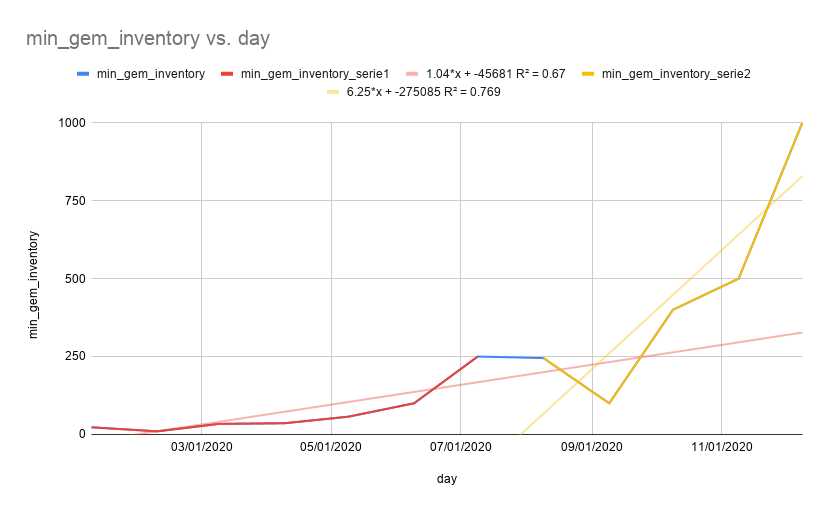
After getting the data on a table like the one above the next step is to plot a chart of the currency vs. the day. So, on the x-axis, we plot the day or the time series and on the y-axis our variable that we want to monitor.
We start by plotting the min_gem_inventory with a blue line. We can see that there seem to be two different periods with the naked eye. At first, we see slow growth until the 7th. Then, a rapid growth period ensues. If this would be real data, probably around the 8th we introduced an update that affected the number of resources that players could get.

Given these two different periods, we plot 2 new series with the days where we see the different behaviors (red and yellow data). From here, we add a trendline with the linear option.
This trendline will create a linear regression of the type y = a x + b . The a coefficient indicates the slope, the greater the number the higher the inflation. The a coefitient also gives us the inflation rate. In our example, during the red period, the players’ gem inventory expands at an average rate of 1.04 gems per day, after the game update that value changed to 6.25 gems per day.
Analysis
If we’re able to track the evolution of the players’ wallets over time, then with simple linear regressions, we’re able to draw a lot of conclusions about the game economy.
If the slope of the linear trend line is greater than 0, then, we have some inflation. If the line moves mostly sideways, there’s an equilibrium. Game economies are dynamic. Often, there’s a need to correlate progression with access to resources. Therefore, equilibria are rare in games.
When the slope goes down, there’s a deflationary period. Good games can find ways of mitigating inflation by adopting strategies that introduce sinks for currencies (places where players spend currencies and make them disappear from the game economy).
PS – This is a high-level article. If you like the way that I approach these subjects, feel free to comment and get in touch. If you have any ideas of topics that you would like to see covered, let me know. I could spend a whole day just talking about empowering game dev teams with data-driven insights non-stop. All the best, Daniela.
The post Monitoring game economy inflation for product people – Data-Driven Product Management appeared first on Daantje on Data.


