
Overview
BTC has been trading in a narrow range between 7000 to around 7600 in early December. While some traders may feel bored in a range-bound market, indicators suggest that BTC’s volatility could increase from here, with a bias slightly on the downside. OKEx BTCUSD Index could also give traders useful insights when it comes to price forecasting.
BTC Sideways Market
Bitcoin has mostly been in a sideways market in early December, as the prices of the leading cryptocurrency have been trading in the 7000 to 7600 area, with no clear direction.While markets have been in the wait-and-see mode,BTC has already traded above the October resistance levels (figure 1 yellow line) despite the recent drift, however, thechance of a pullback could increase if that resistance levels are compromised.
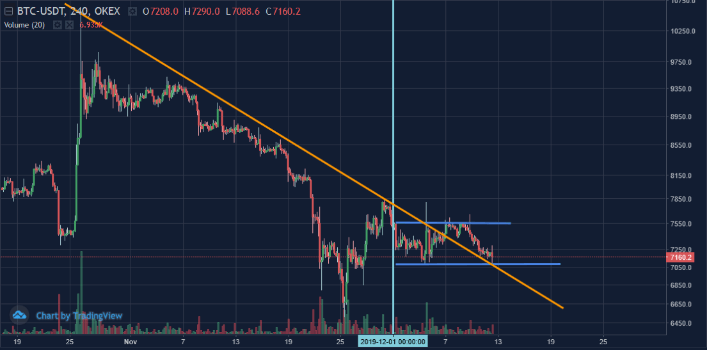
Figure 1a:BTCUSDT 4-Hour Chart(Source: OKEx; Tradingview)
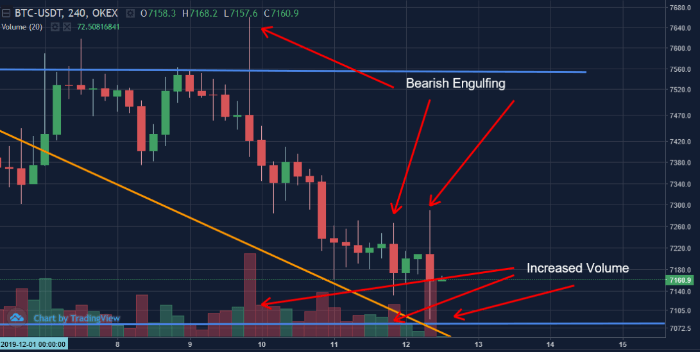
Figure 1b: BTCUSDT 4-Hour Chart Bearish Engulfing (Source: OKEx; Tradingview)
Short-term Bias Towards Downside; Volatility Set to Increase?
Candlestick patterns and technical indicatorshave suggested that BTC volatility could increase in the short-term, with a bias slightly towards to the downside.
Figure 1b shows that BTCUSDT has produced multiple 4-hour bearish engulfing patterns recently with increased trade volume. That could indicate sellers have overtaken buyers and driven the price lower. A retest of the lower end of the December channel is getting more likely if the short-term pressure persists.
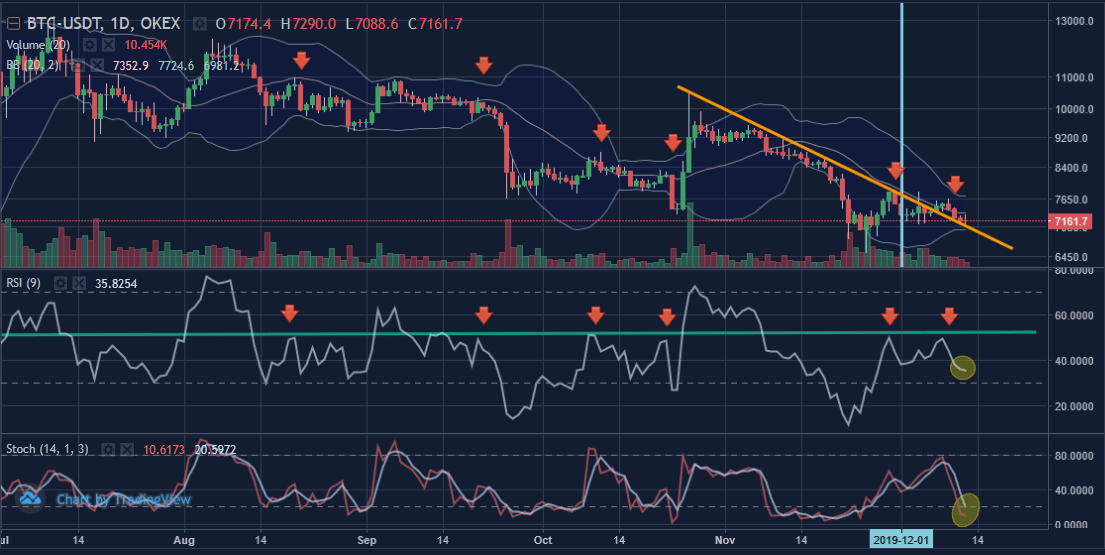
Figure 2: BTCUSDT Daily Chart(Source: OKEx; Tradingview)
Volatility-wise, a dailyBollinger Bandsqueezeis apparently in the making, suggesting the potential of the increase in price volatility in the future, although it’s hard to determine how long that squeeze period will last, or the timing of a breakout occurs.
We would also like to highlight that BTCUSDT still hasn’t touched the lower Bollinger band on a daily chart. However, momentum indicators suggest thatthere’s still room for the price to go a little lower.
The 9-day RSI has been staying at around 35recently after reaching 50 earlier this month, which, 50 seems like a significate level for BTCUSDT (red arrows). The pair had shown a behavioral rebound when the 9-day RSI touchedor went below 30. Therefore, the current RSI reading of 35 suggests that the price may still havefurther room to go lower. Besides, the stochastic oscillator also suggests the same thing, strengthening a short-term bearish case.
OKEx BTCUSD Index Suggests Price Fluctuation Ahead
There appears to be the current sideways market conditionthat seems unmatching with the past ranges of the OKEx BTCUSD Index. This divergence as well reinforced the idea thathigher BTC volatility could be possible before the year-end.
The table below shows that the monthly ranges of the OKEX BTCUSD Index in 2019. For the past three months, the Index has produced a range of over 3000 each month. For the first 11 months this year, the average monthly range has reached 2772.
| 2019 | Jan | Feb | Mar | Apr | May | Jun | Jul | Aug | Sep | Oct | Nov | Dec | |
| High | 4110.67 | 4187.52 | 4148.34 | 5631.04 | 9088.86 | 13852.63 | 13192.46 | 12318.55 | 10942.9 | 10491.69 | 9583.76 | ||
| Low | 3341.23 | 3342.57 | 3672.72 | 4052.31 | 5225.51 | 7444.66 | 9081.46 | 9324.06 | 7709.05 | 7332.63 | 6526.63 | ||
| Diff | 769.44 | 844.95 | 475.62 | 1578.73 | 3863.35 | 6407.97 | 4111 | 2994.49 | 3233.85 | 3159.06 | 3057.13 | Average:2772.326 |
Table 1: OKEx BTCUSD Index Monthly Ranges
Source: OKEx
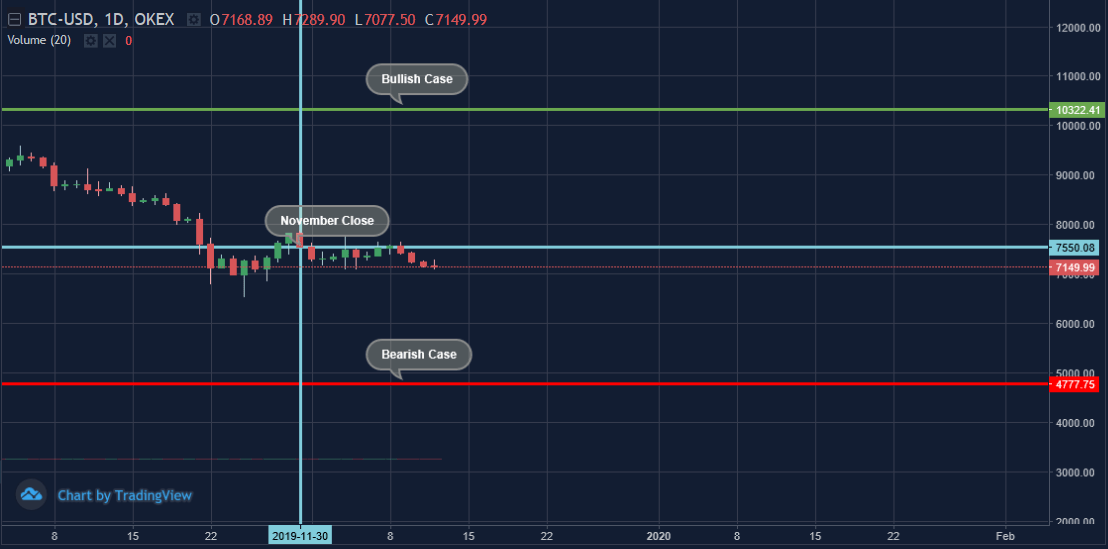
Figure 3: OKEx BTCUSD Index Daily Chart(Source: OKEx; Tradingview)
At the time of writing, the December sideways market has produced a less than 700 range, that is way below than many of the past months and the average. That could furtherincrease the likelihood of seeing higher volatilityin BTC markets before the end of the year.
It’s worth noting that higher market volatility doesn’t necessarily meanthe price goes down, a significant price surge could also bring up the overall market volatility.


