In anticipation of spring—the retreat of snow, blooming of flowers and warming temperatures—we’ve bundled together your favorite seasonal trends. They are:
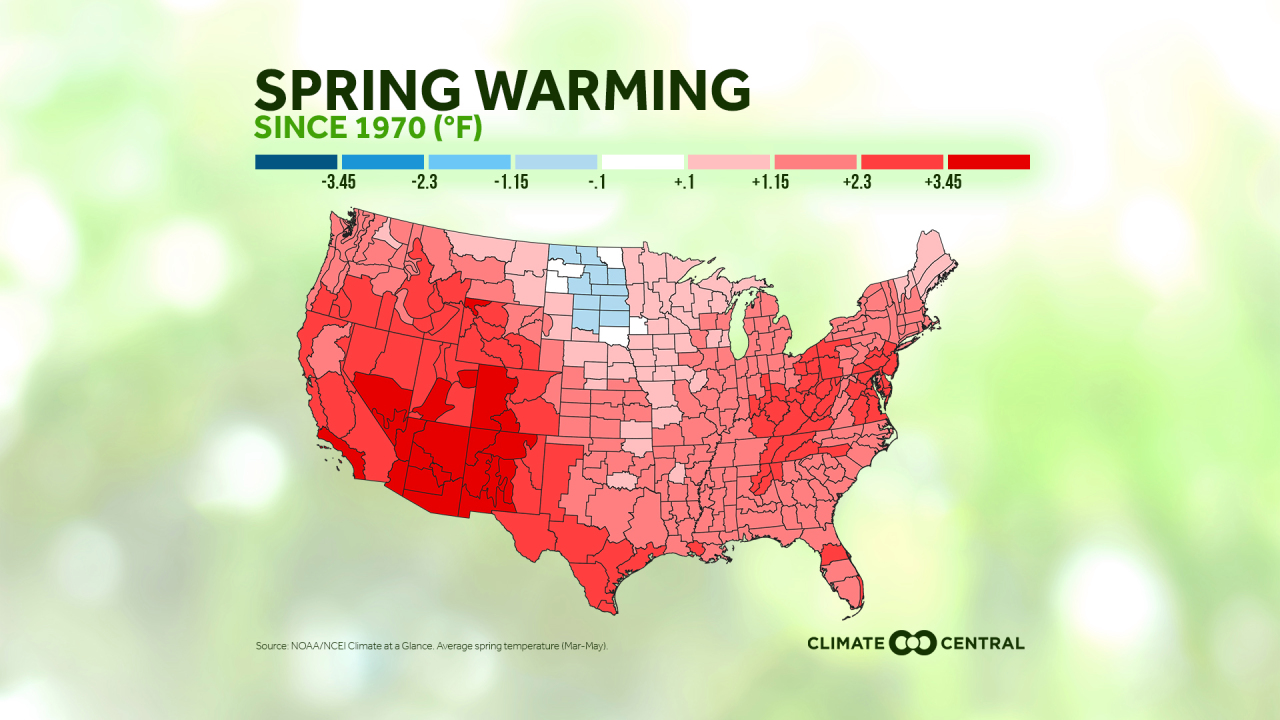
- Spring average temperature trends locally and nationally
- Change in the number of spring days with above normal temperatures

We just experienced a spate of winter storms and record-breaking cold air plunging across the middle of the country, precipitating the massive power failure in Texas, as well as the opening of emergency warming centers across states from Virginia to Louisiana. There is evidence to suggest that climate change can influence the tropospheric polar vortex, allowing the polar jet stream to break down and allow arctic air to dip into the lower latitudes. But, ready or not, the beginning of March next week also means the start of meteorological spring.
Long-term temperature trends show that, on average, spring is getting warmer. According to our analysis of 243 cities across the U.S., 120 cities (49%) have recorded an increase of 2℉ or more over the past fifty years. Further, 96% of cities (234) reported an increase in the number of above-normal spring days since 1970, with 81% of cities (196) reporting an increase of 5 days or more.

Warming spring temperatures follow a pattern of warmer seasons encroaching on the cold of winter—shrinking periods of cold that are important for the production of fruit, management of pest populations, and throwing the timing of natural events (known as phenology) into misalignment. Earlier snowmelt can result in changes in water availability and challenges to the breeding of native fish. Earlier spring temperatures can also lengthen the growing season, supporting longer pollen allergy seasons that start earlier and stick around for longer.
METHODOLOGY
Analyses used 1970-2020 data from the Applied Climate Information System. The number of spring days above normal was calculated using the 1981-2010 NOAA/NCEI normals.
Displayed trend lines are based on a mathematical linear regression. Climate Central’s local analyses include 246 stations. However, for data summaries based on linear trends, only 243 stations are included due to large data gaps in Tuscaloosa, Hazard and Wheeling.


