
Many organizations start a Sales and Operations Planning (S&OP) process with little implementation experience, and armed with a few books and articles on the subject. When times get hard or the process stalls, S&OP leaders can utilize an S&OP maturity matrix and a SWOT analysis to determine the next step that is best for their situation.
You always wanted to, and this year was finally the time to plant your own garden. The benefits of home gardening are obvious, and include eating more fresh fruits and vegetables, exercising, and growing what is right for you.
How hard can it be? You’ve read a few articles, viewed photos of award-winning gardens online and watched plenty of “how-to” videos. You planned out your garden, purchased your supplies, and planted the seeds. It was not easy, but signs of life sprouted from the ground. Soon came the first fruits and vegetables, but also the weeds, pests, and less-than-perfect weather conditions. What seemed like a good idea had now become hard work and you’re searching up “brown spots on leaves” online to self-diagnose your plants’ problems and salvage that harvest you dreamed of.
Integrating Demand & Supply With S&OP
Like that garden, many a supply chain practitioner has dreamed of harvesting the fruits of Demand-Supply Integration. Sales and Operations Planning (S&OP) is a monthly process that helps to align the functions of a company while balancing demand and supply. Many times, armed with little more than some “how-to” articles, an S&OP process is planned, planted and nurtured to life. It, too, requires ongoing care and maintenance to receive the full benefit you envisioned, but where do you turn to solve your S&OP’s “brown spots on leaves?”
Company Example
Let’s look at a hypothetical example of a ball bearing manufacturer who started an S&OP process two years ago. The company hired a supply chain professional with previous S&OP experience who tailored the process to fit the needs of the company. Like many do-it-yourself implementations, the leader began rolling out S&OP, but was pulled into daily responsibilities and fire-fighting that slowed the implementation and limited the benefits. After two years, there were definitely roots of the process taking hold, but also brown spots on the leaves. At any point, it felt like the S&OP process would blossom with benefits or perish from neglect and other priorities. It is at this point that S&OP leaders turn to the internet for help. Online “experts” claim the need for stronger leadership from the top, improved cross-functional engagement, cleaner data, and more, but are those the right things for this business to achieve the true benefits from S&OP?
IBF’s S&OP Maturity Self-Assessment
An S&OP maturity model is one tool that can help you to assess the current state of your process, highlight areas that can be improved, and show what best practices look like. While there are many S&OP maturity models available, the Institute of Business Forecasting and Planning (IBF) offers an easy-to-use, online S&OP Maturity Self-Assessment. IBF’s tool divides the evaluation into four dimensions:
- People
- Process
- Analytics
- Technology
Within each of these four dimensions, users must rate attributes of their S&OP process against attribute statements by scoring them on a scale of 1–100. In total, the assessment has 13 attributes. Based on your answers, your S&OP process is assigned a maturity level from Emerging to the top-rated Vanguard.
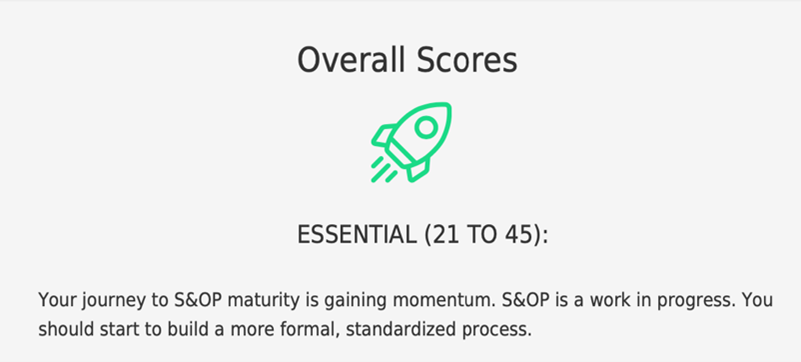
One of the outputs of IBF’s S&OP Maturity Model, revealing where your company stands relative to your competitors.
The S&OP Leader of our ball bearing manufacturing company completed the IBF S&OP Maturity Self-Assessment questionnaire, and the company was classified as “Essential” meaning that it was further along than an “Emerging” company, but not yet demonstrating the best practices of a “Vanguard” company. While the score and classification are helpful, the Assessment pointed to the Analytics attribute as the specific area that lagged the other attributes – particularly in the areas of Metrics and Analytics.
Looking at the detailed output (See Figure 1), Metrics and Analytics scored low and lagged the Comparative Benchmark, but so did Decisions, Data, Systems and Culture. When looking at the Analytics attributes output from the Assessment, here is where the Company scored:
- Metrics: Some metrics exist but are functional and not connected to wider business objectives and there is no structure for defining targets. Metrics may include forecast accuracy and inventory dollars.
- Analytics: Your primary use of technology is for descriptive analytics and reporting. There is limited/no business intelligence function to support understanding of the trade-offs of business decisions.
The company would benefit by adding more and/or better metrics into the meeting agendas and by having a better understanding of trade-offs to solve gaps over the planning horizon. The question the S&OP Leader must ask is if investing time and resources into the lowest scoring areas is the best for this company.
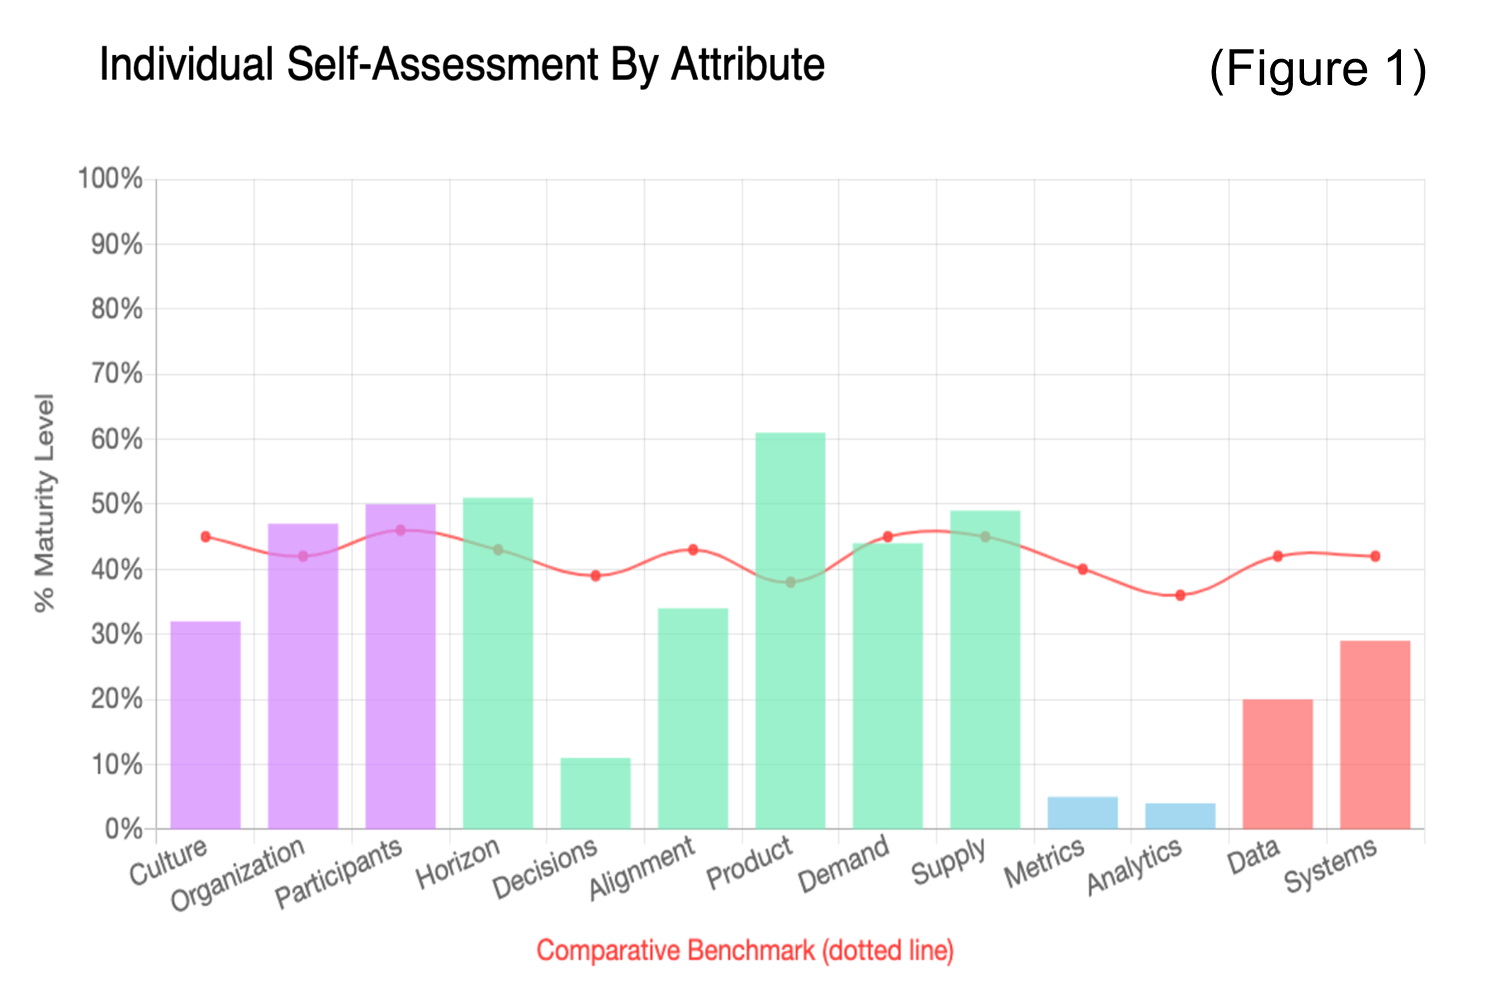
IBF’s S&OP Maturity Model allows you to benchmark your S&OP across 13 different attributes.
Using The Maturity Model For SWOT Analysis
Using a SWOT Analysis – a technique used to identify Strengths, Weaknesses, Opportunities and Threats – can help the S&OP Leader augment the findings from the IBF’s S&OP Maturity Self-Assessment tool and help determine next steps.
For our ball bearing manufacturing company, the SWOT looks like the following (where each maturity model attribute is assigned as a Strength, Weakness, Opportunity or Threat):
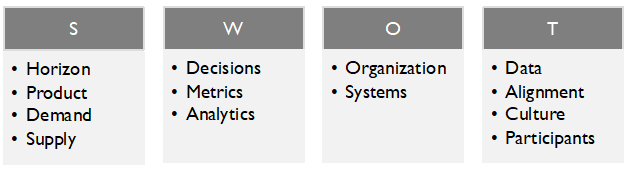
IBF’s S&OP Maturity Model is often used in SWOT analysis.
By applying the scores from the assessment, understanding the gaps to the benchmarks and knowing the culture and norms of the company, the S&OP Leader can categorize the 13 attributes into the SWOT. The Strengths and Weaknesses can be straightforward by placing the highest scoring attributes as Strengths and the lowest as Weaknesses. Opportunities and Threats will be more subjective. For example, the company recently implemented an Advanced Planning System (APS) for Demand and Capacity Planning. At the time of the assessment, the APS was not delivering its full potential, but as it rolls out and users become more proficient, the Systems score should improve. Therefore, it was categorized not as a Weakness, but as an Opportunity because of the natural upside to the Company and the S&OP process.
Alignment, however, was categorized as a Threat. While the company has a standardized process, which includes an executive review and a one number forecast, plans are not fully linked to company objectives or financial reporting and the threat exists that “side processes” may undermine the long-term viability of the S&OP process. Participants may begin to see that the time they are investing in S&OP is not being used by Company Leadership, and they may become less engaged. Therefore, Alignment was categorized not as a Weakness, but as a Threat because of its potential to erode the effectiveness of the S&OP process.
Acting On Your SWOT Findings
By completing the IBF’s S&OP Maturity Self-Assessment and categorizing the thirteen attributes into a SWOT analysis, an S&OP Leader can best determine the next steps to improve the S&OP process. The combination gives the S&OP Leader three paths:
- Focus on Weaknesses: By investing improvement efforts in these areas, lagging process attributes are brought up to par with the rest of the process. In the company’s example, improving the use of Metrics and Analytics and driving more Decisions within the S&OP process will add value to the company.
- Double Down on Strengths and Opportunities: By focusing on the areas that are doing well and those attributes that can easily contribute more, the S&OP Leader may be able to invest a lower amount of effort to get benefits across all thirteen areas. For example, with an even better Demand Review Meeting (DRM), company leaders may not need “side processes” because the one number forecast from the DRM can be confidently used across the company. In turn, this will improve the Decisions attribute because now the S&OP process is a fully integrated forum to support decision making across business functions and time horizons.
- Confront the Threats: If the Threats are not addressed, the benefits of the S&OP process may not be able to offset the downsides and the entire S&OP process may perish from neglect and other priorities. If the S&OP Leader, for example, can focus more attention on process roles and responsibilities, drive active involvement from all key functional areas and have full C-suite level executive sponsorship and participation, the S&OP process will not wilt but continue to grow across all areas of the business.
Conclusion
You have taken the hardest step of starting an S&OP process within your company. It has not been a linear path, but one with both successes and challenges. Using an S&OP maturity matrix will help you to understand areas in which you are winning and areas you can improve. Augmenting the output of the maturity matrix by categorizing the matrix attributes into a SWOT can give you additional insights as to your next steps. Which of the three options is the best next step for your S&OP process? Remember why you began this process in the first place, know the environment in which you are operating, and work with the data you have, and then make the choice that gives you the award-winning harvest you dreamed of.
To Make S&OP a reality in your organization, attend IBF’s Virtual S&OP/IBP Boot Camp (with 1-day Supply Planning Workshop) on February 22, 24 and 26. You’ll learn from renowned leaders how to establish or improve your S&OP process and truly integrate demand and supply and improve key KPIs like cash flow, revenue, forecast accuracy, inventory turns, and more.


