The Cornell Lab of Ornithology has been the center of bird science in the U.S., and in many ways the world, since it was created by Arthur A. Allen in 1915. Showing that birds weren’t always the star of wildlife research, the lab was originally located in the university’s entomology (bugs) and limnology (fresh water) department.
When I visited the lab for the first time in the ‘80s, it was still a quaint collection of modest buildings, looking like the university wasn’t yet serious about ornithology. That exterior did not do justice to the thinking, research, and creativity that was running deeply just behind those simple walls.
Times have changed. The lab has conducted ornithological science at a stunning rate since those days, with the outward appearance being totally transformed by a new building in 2003. Behind the scenes are 18 senior staff and a membership of 75,000 bird enthusiasts.
Further, nearly 600,000 people contribute to the lab’s many citizen science projects, such as eBird and Project FeederWatch. eBird has taken the collection and analysis of bird data to a high level. Many of us now routinely track and report the birds we see using the eBird app on our phones. This tool could hardly be easier to use. When you’re finished with a bird checklist, you hit “submit” to upload your data to eBird’s global database.
eBird has far too many features to even mention in one newspaper column. Today, I just want to look at one feature — data visualization. You can get a more thorough introduction to eBird from the talk on my YouTube channel, “Bird Talk with Terry Rich.” Although that talk is almost an hour and a half long, I still didn’t cover all of eBird.
Data visualization is simply the art of turning numbers into pictures. We do it all the time. Every bar graph or pie chart is a visualization. It’s amazing how quickly we can grasp 100 years of data in a graph while looking at those same numbers in an Excel file would be about as useful as looking at hieroglyphics. We can literally see, for example, if a trend is up, down, stable, has cycles, or just messy.
Probably the most common form of data visualization for birders is the range map. I note that my first field guide, “A Field Guide to the Birds” by Roger Tory Peterson (1934), did not have range maps. Peterson used words to describe the occurrence of each species during the breeding, wintering, and migratory periods.
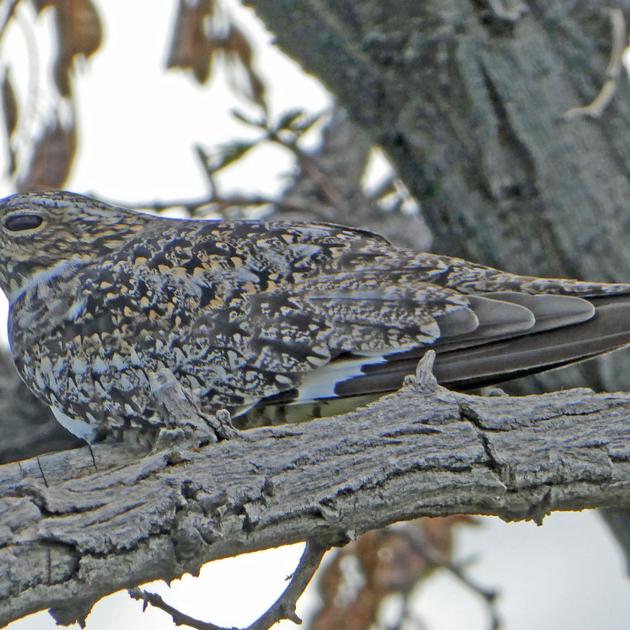
For the common nighthawk, which I will use to illustrate my points here, Peterson used a mere 20 words to describe these ranges. In Peterson’s “A Field Guide to Western Birds” published in 1941, he added a bit more detail, employing 30 words to describe ranges.
A quick look at an actual range map shows how inadequate these verbal descriptions were. In my early birding days in the 1960s, we didn’t often use range to eliminate the possible identification of a species. The information just wasn’t there. You had to rely on field marks, vocalizations, date, habitat, and other birders.
The first field guide I had that included maps was “A Guide to Field Identification — Birds of North America” by Robbins, Bruun, and Zim (1966). The maps were a wonderful addition, showing ranges for winter, breeding, year-round residency, spring migration, and fall migration. Further, the authors added lines to show about how far north a species was by the first day of March, April, May, and June in a typical year.
These maps provided much useful additional information for birders trying to figure out what species they were looking at. For example, the map for the common nighthawk from the 1966 guide shows the species occurring across the U.S. What was really useful was the dot-dash line showing that they don’t get to Idaho until after June 1.
But also note that there is no information about the winter range. I have to admit that in 1966 that didn’t matter too much to me because I had no notion that I might go to the winter range of this species in the Amazon. (I’ve now been there several times.) Even the information that common nighthawks both bred in, and migrated through, Mexico was only vaguely useful. Like many beginning birders in those days, I was almost totally focused on the breeding season.
Since those first maps were produced, range maps have been steadily upgraded. Improvements were mostly based on accumulating more data on distribution and better mapping techniques. Maps at Cornell’s allaboutbirds.org and birdsoftheworld.org are good examples.
The next jump in the information provided by a range map came in 1995 when Price, Droege, and Price, in “The Summer Atlas of North American Birds” created breeding range maps that showed bird densities. For the first time you could see not only if a species was in a particular place or not, but how relatively abundant they were.
More recent versions of maps created in this way are available at mbr-pwrc.usgs.gov. Click on “Survey results” and then “Distribution maps 1966-2015” to get to a menu where you can scroll to the species you want.
There are a number of assumptions behind these maps and you should become familiar with them before taking anything to the bank. But when they came out in 1995 they provided a leap in our idea of what a range map could portray.
I remained surprised that for decades none of the many field guides that continued to be produced picked up on the idea of mapping density. It wasn’t until Cornell and eBird came on the scene that density mapping finally made it to the big time.
The foundation for the new range maps is the eBird global database, launched in 2002. As of a year ago, there were 737 million bird observations in the database. By the time the 2020 year-end review is completed, this number will be substantially larger, probably by another 100 million.
It only takes a second to appreciate that the common nighthawk range map from eBird is wildly superior to anything created before. Higher densities of breeding birds are shown by darker red while nonbreeding densities are given in yellow. We also get surprisingly good resolution from Central and South America. But wait. There’s more!
eBird was not content with simply creating superb, new, static maps. They have also animated them. You can view these maps at ebird.org/science/status-and-trends. Watch common nighthawks piled up in South America in December explode northward in spring to extend all the way to the edge of Alaska by the week of July 6. You can pause the animation to see that they hit Idaho the week of May 24, just slightly earlier than portrayed by Robbins, Bruun, and Zim in 1966.
For the common nighthawk, there are maps for breeding, spring migration, and fall migration, as well as the animation. But there is no non-breeding map because there aren’t enough data from their winter range in the heart of the Amazon Basin. Pick another species you like, say the western tanager, to see all the types of maps.
I hesitate to say, “that’s all excellent, but wouldn’t it be cool if you could ———_ ?” We should not take for granted the resources, time, and creativity that has already gone into eBird. But this amazing set of tools will continue to evolve and expand. So … wouldn’t it be cool if you could get distribution maps for any species, as of some date, on your phone? You know they’re coming.


