
This article is part of “AI education”, a series of posts that review and explore educational content on data science and machine learning. (In partnership with Paperspace)
Machine learning and deep learning have become an important part of many applications we use every day. There are few domains that the fast expansion of machine learning hasn’t touched. Many businesses have thrived by developing the right strategy to integrate machine learning algorithms into their operations and processes. Others have lost ground to competitors after ignoring the undeniable advances in artificial intelligence.
But mastering machine learning is a difficult process. You need to start with a solid knowledge of linear algebra and calculus, master a programming language such as Python, and become proficient with data science and machine learning libraries such as Numpy, Scikit-learn, TensorFlow, and PyTorch.
And if you want to create machine learning systems that integrate and scale, you’ll have to learn cloud platforms such as Amazon AWS, Microsoft Azure, and Google Cloud.
Naturally, not everyone needs to become a machine learning engineer. But almost everyone who is running a business or organization that systematically collects and processes can benefit from some knowledge of data science and machine learning. Fortunately, there are several courses that provide a high-level overview of machine learning and deep learning without going too deep into math and coding.
But in my experience, a good understanding of data science and machine learning requires some hands-on experience with algorithms. In this regard, a very valuable and often-overlooked tool is Microsoft Excel.

To most people, MS Excel is a spreadsheet application that stores data in tabular format and performs very basic mathematical operations. But in reality, Excel is a powerful computation tool that can solve complicated problems. Excel also has many features that allow you to create machine learning models directly into your workbooks.
While I’ve been using Excel’s mathematical tools for years, I didn’t come to appreciate its use for learning and applying data science and machine learning until I picked up Learn Data Mining Through Excel: A Step-by-Step Approach for Understanding Machine Learning Methods by Hong Zhou.
Learn Data Mining Through Excel takes you through the basics of machine learning step by step and shows how you can implement many algorithms using basic Excel functions and a few of the application’s advanced tools.
While Excel will in no way replace Python machine learning, it is a great window to learn the basics of AI and solve many basic problems without writing a line of code.
Linear regression machine learning with Excel
Linear regression is a simple machine learning algorithm that has many uses for analyzing data and predicting outcomes. Linear regression is especially useful when your data is neatly arranged in tabular format. Excel has several features that enable you to create regression models from tabular data in your spreadsheets.
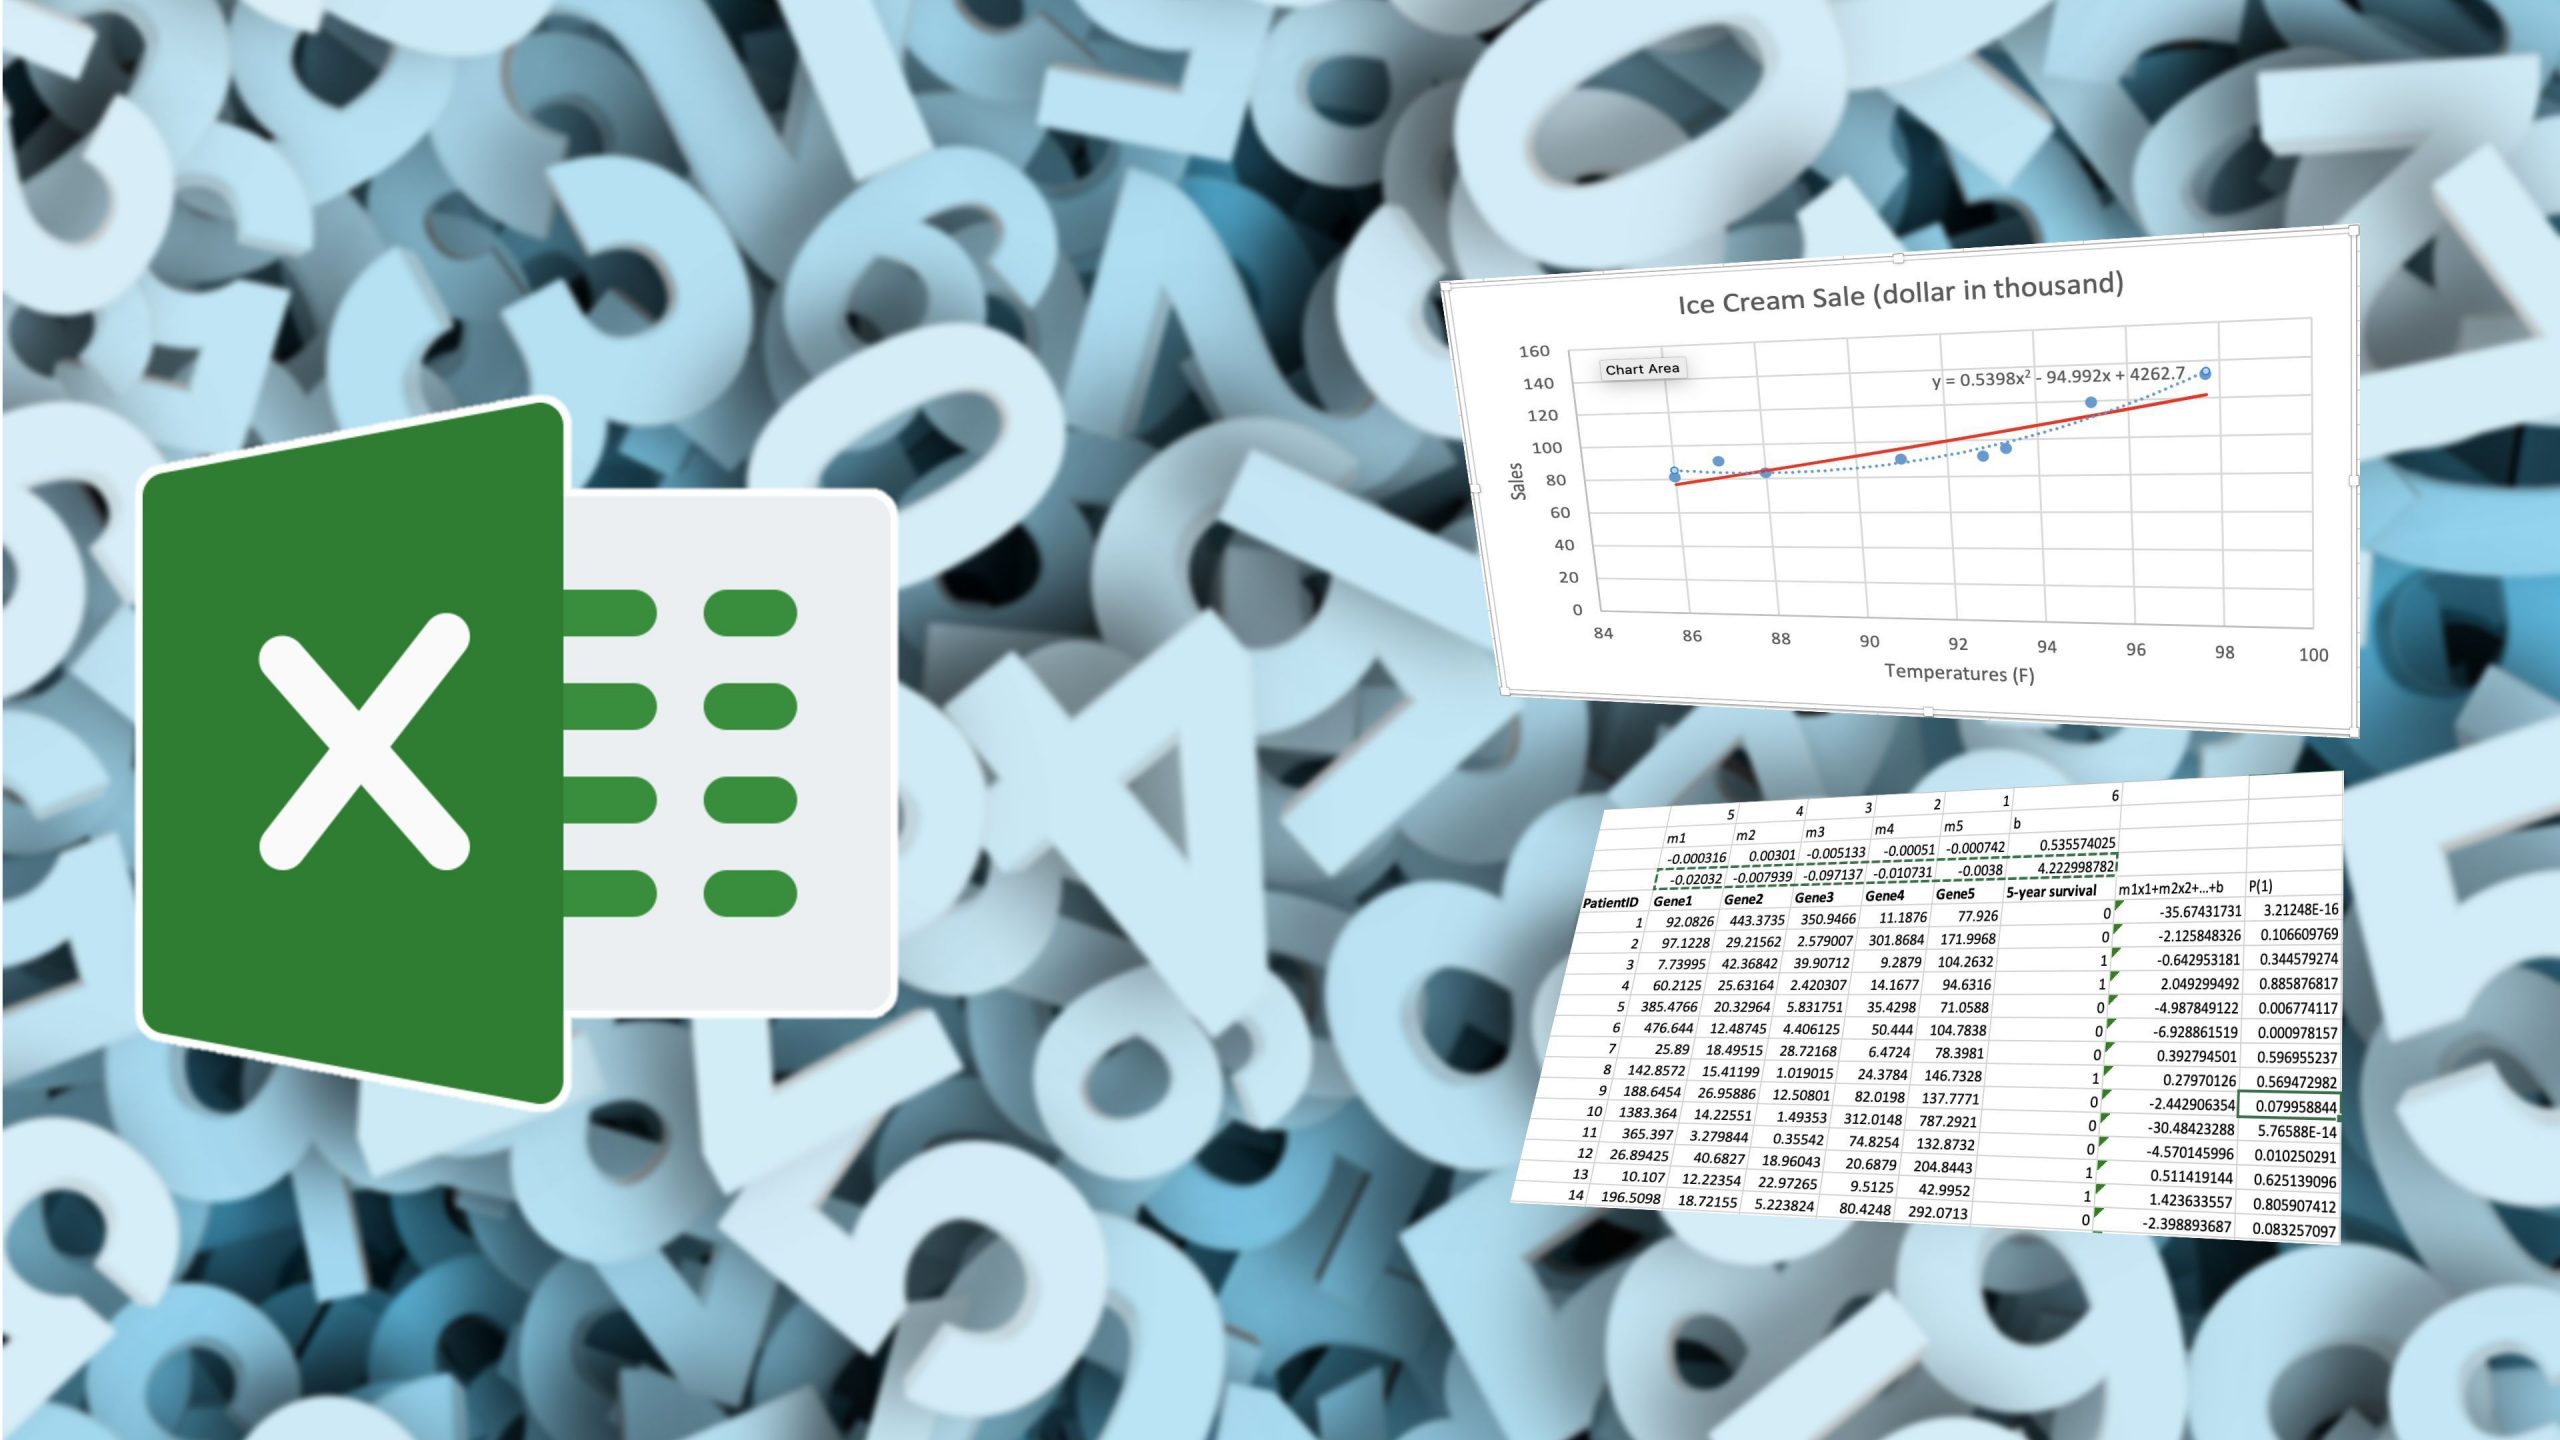
One of the most intuitive is the data chart tool, which is a powerful data visualization feature. For instance, the scatter plot chart displays the values of your data on a cartesian plane. But in addition to showing the distribution of your data, Excel’s chart tool can create a machine learning model that can predict the changes in the values of your data. The feature, called Trendline, creates a regression model from your data. You can set the trendline to one of several regression algorithms, including linear, polynomial, logarithmic, and exponential. You can also configure the chart to display the parameters of your machine learning model, which you can use to predict the outcome of new observations.
You can add several trendlines to the same chart. This makes it easy to quickly test and compare the performance of different machine learning models on your data.

In addition to exploring the chart tool, Learn Data Mining Through Excel takes you through several other procedures that can help develop more advanced regression models. These include formulas such as LINEST and LINREG formulas, which calculate the parameters of your machine learning models based on your training data.
The author also takes you through the step-by-step creation of linear regression models using Excel’s basic formulas such as SUM and SUMPRODUCT. This is a recurring theme in the book: You’ll see the mathematical formula of a machine learning model, learn the basic reasoning behind it, and create it step by step by combining values and formulas in several cells and cell arrays.
While this might not be the most efficient way to do production-level data science work, it is certainly a very good way to learn the workings of machine learning algorithms.
Other machine learning algorithms with Excel
Beyond regression models, you can use Excel for other machine learning algorithms. Learn Data Mining Through Excel provides a rich roster of supervised and unsupervised machine learning algorithms, including k-means clustering, k-nearest neighbor, naïve Bayes classification, and decision trees.
The process can get a bit convoluted at times, but if you stay on track, the logic will easily fall in place. For instance, in the k-means clustering chapter, you’ll get to use a vast array of Excel formulas and features (INDEX, IF, AVERAGEIF, ADDRESS, and many others) across several worksheets to calculate cluster centers and refine them. This is not a very efficient way to do clustering, you’ll be able to track and study your clusters as they become refined in every consecutive sheet. From an educational standpoint, the experience is very different from programming books where you provide a machine learning library function your data points and it outputs the clusters and their properties.

In the decision tree chapter, you will go through the process calculating entropy and selecting features for each branch of your machine learning model. Again, the process is slow and manual, but seeing under the hood of the machine learning algorithm is a rewarding experience.
In many of the book’s chapters, you’ll use the Solver tool to minimize your loss function. This is where you’ll see the limits of Excel, because even a simple model with a dozen parameters can slow your computer down to a crawl, especially if your data sample is several hundred rows in size. But the Solver is an especially powerful tool when you want to finetune the parameters of your machine learning model.

Deep learning and natural language processing with Excel
Learn Data Mining Through Excel shows that Excel can even advanced machine learning algorithms. There’s a chapter that delves into the meticulous creation of deep learning models. First, you’ll create a single layer artificial neural network with less than a dozen parameters. Then you’ll expand on the concept to create a deep learning model with hidden layers. The computation is very slow and inefficient, but it works, and the components are the same: cell values, formulas, and the powerful Solver tool.

In the last chapter, you’ll create a rudimentary natural language processing (NLP) application, using Excel to create a sentiment analysis machine learning model. You’ll use formulas to create a “bag of words” model, preprocess and tokenize hotel reviews and classify them based on the density of positive and negative keywords. In the process you’ll learn quite a bit about how contemporary AI deals with language and how much different it is from how we humans process written and spoken language.
Excel as a machine learning tool
Whether you’re making C-level decisions at your company, working in human resources, or managing supply chains and manufacturing facilities, a basic knowledge of machine learning will be important if you will be working with data scientists and AI people. Likewise, if you’re a reporter covering AI news or a PR agency working on behalf a company that uses machine learning, writing about the technology without knowing how it works is a bad idea (I will write a separate post about the many awful AI pitches I receive every day). In my opinion, Learn Data Mining Through Excel is a smooth and quick read that will help you gain that important knowledge.
Beyond learning the basics, Excel can be a powerful addition to your repertoire of machine learning tools. While it’s not good for dealing with big data sets and complicated algorithms, it can help with the visualization and analysis of smaller batches of data. The results you obtain from a quick Excel mining can provide pertinent insights in choosing the right direction and machine learning algorithm to tackle the problem at hand.


