
One of the key political issues during the Covid-19 pandemic has been the extent to which health outcomes should be balanced against the economic costs associated with lockdowns and other virus suppression measures. Reviewing some of the recent evidence, Bernard H Casey writes that it is by no means clear the trade-off between sacrificing lives and sacrificing the economy is as real as has been suggested.
In mid-November, the Institute for New Economic Thinking (INET) published a paper entitled To save the economy, save people first. It sought to demonstrate both that lockdowns work and to indicate what other measures could slow and even suppress Covid-19, and why. The paper contained the chart reproduced below, which is described “as effectively a rough representation of how well each country has protected its citizens versus the cost of doing so”.
In the words of Martin Wolf, the chart shows how “countries have followed two strategies: suppression, or trading off deaths against the economy. By and large, the former group has done better in both respects. Meanwhile, countries that have sacrificed lives have tended to end up with high mortality and economic costs”.
Figure 1: Covid-19 ‘lives versus livelihoods’

Source: Institute for New Economic Thinking (INET)
To see if there is a trade-off between costs to the economy and number of deaths, the above chart should be read as follows. The top right corner represents the best possible situation – low loss of output and a low number of deaths. The bottom left corner represents the worst possible situation – high loss and a high number of deaths. If there were a trade-off, observations would fall along a line running from the top left to the bottom right. If the two outcomes were complementary, observations would fall on a line running from the top right to the bottom left.
What the data tells us
In fact, the chart is no more than a scattergram. The arrows have been imposed upon it. They do not plot causal relationships. The question is whether any relationship can be shown, and if so, what it is.
Note that the chart has the vertical axis below the horizontal axis and not above it. Normally, such a chart would be rotated 180 degrees along the horizontal axis, so that deaths would start at zero and go vertically up to 1200. This would make the “sacrifice to save lives” line downward sloping from left to right, rather than from right to left. The slope of the line would suggest each one percentage point increase in economic loss was associated with an additional 64 deaths per million of population (this is an approximation obtained by measuring off distances in the chart and calculating on that basis).
I extracted the data used from references given in the original paper. I took, first, a simple correlation of number of deaths and economic loss. This gave a correlation coefficient of (negative) 0.389 – the number of deaths and economic loss is correlated, although not particularly strongly. I also correlated the number of deaths and the output fall alone (i.e., excluding the additional expenditures, credits granted, etc.) This gave a stronger correlation of (negative) 0.705 – the number of deaths and output fall are quite well correlated.
Second, I made a simple regression of deaths (y) on economic loss (x). This is the relationship implied by the chart. However, an x to y relationship is problematic. Many of the variables in the x-axis are endogenous. Additional health expenditures might well be engendered by deaths (or at least illnesses). The same applies to expenditures to prop up the economy (furlough schemes, business loan schemes, etc.)
Simple, bivariate regressions do suggest the relationship of greater economic loss “causing” more deaths. The coefficient on the dependent variable was statistically significant at 95%. However, it implied that each one percentage point increase in economic loss was associated with rather fewer than 12 extra deaths per million – a much smaller number than the “sacrifice lives to save economy” line in the chart showed. Moreover, the R2 of the regression was approximately 0.15 – so only 15 percent of the change in deaths was consequent on changes in economic loss.
I also attempted the regression with output loss alone as the independent variable. Again, the relationship was as before, and the slope coefficient was significant. The regression implied that each one percentage point increase in loss was associated with over 36 more deaths per million. The R2 was considerably higher – at 0.50.
The data used in the INET analysis seems, to a large part, to be driven by its availability. Obtaining the number of Covid-19 deaths was less problematic, but obtaining the size of Covid-related government expenditures was more so, as was obtaining GDP growth for q2 2019 to q2 2020. The countries used in the analysis are extremely heterogeneous. Countries such as China and Belgium seem to determine the “sacrifice lives to save the economy” arrow. The “sacrifice economy to save lives” arrow seems somewhat unnatural and could be placed at a number of points on the y axis – for example, along the level of Italy to Mexico.
Nonetheless, it seemed worth testing for a relationship amongst the group of advanced, capitalist western countries (these are primarily democratic and have relatively rich economies). This constituted my third step. I excluded countries classified as “emerging markets”. This reduces the data set from its current size of 30 to 20 “advanced economies” (AEs). The correlations reported earlier changed substantially. That between deaths and economic loss fell to (negative) 0.305; that between deaths and fall in output fell to (negative) 0.584.
The regressions suggest an even weaker relationship. That between economic loss and deaths now has an R2 of only 0.09. Moreover, the slope coefficient, whilst still negative, is not statistically significant. In other words, there is no real relationship between increase in economic loss and increase in number of deaths. The line is, effectively, a horizontal one. In the chart, it would cross the y axis at rather less than 200 deaths per million (constant = 171). The regression of output loss and deaths has an R2 of 0.34, which is greater than for the full data set. This time, the slope coefficient is negative and statistically significant, and is very similar to that obtained for the full data set.
Table 1: Data analysis of relationship between economic/output loss and deaths

Source: Author’s calculations
Insofar as the relationship between economic contraction and deaths is the stronger of the relationships examined, I decided to look at the extent to which economic stimulus measures sought to compensate output loss. In fact, the relationship between these two variables is also not strong – as figure 2 and figure 3 below indicate. The correlation between output loss and stimulus expenditure is only (negative) 0.311. A linear regression yielded a slope coefficient that, although appropriately sloped, was not significantly different from zero – in other words, a flat line. This suggests that policy responses were not targeted as effectively as they might have been – something which the OECD has recently commented upon, too.
Figure 2: Stimulus expenditure and output loss
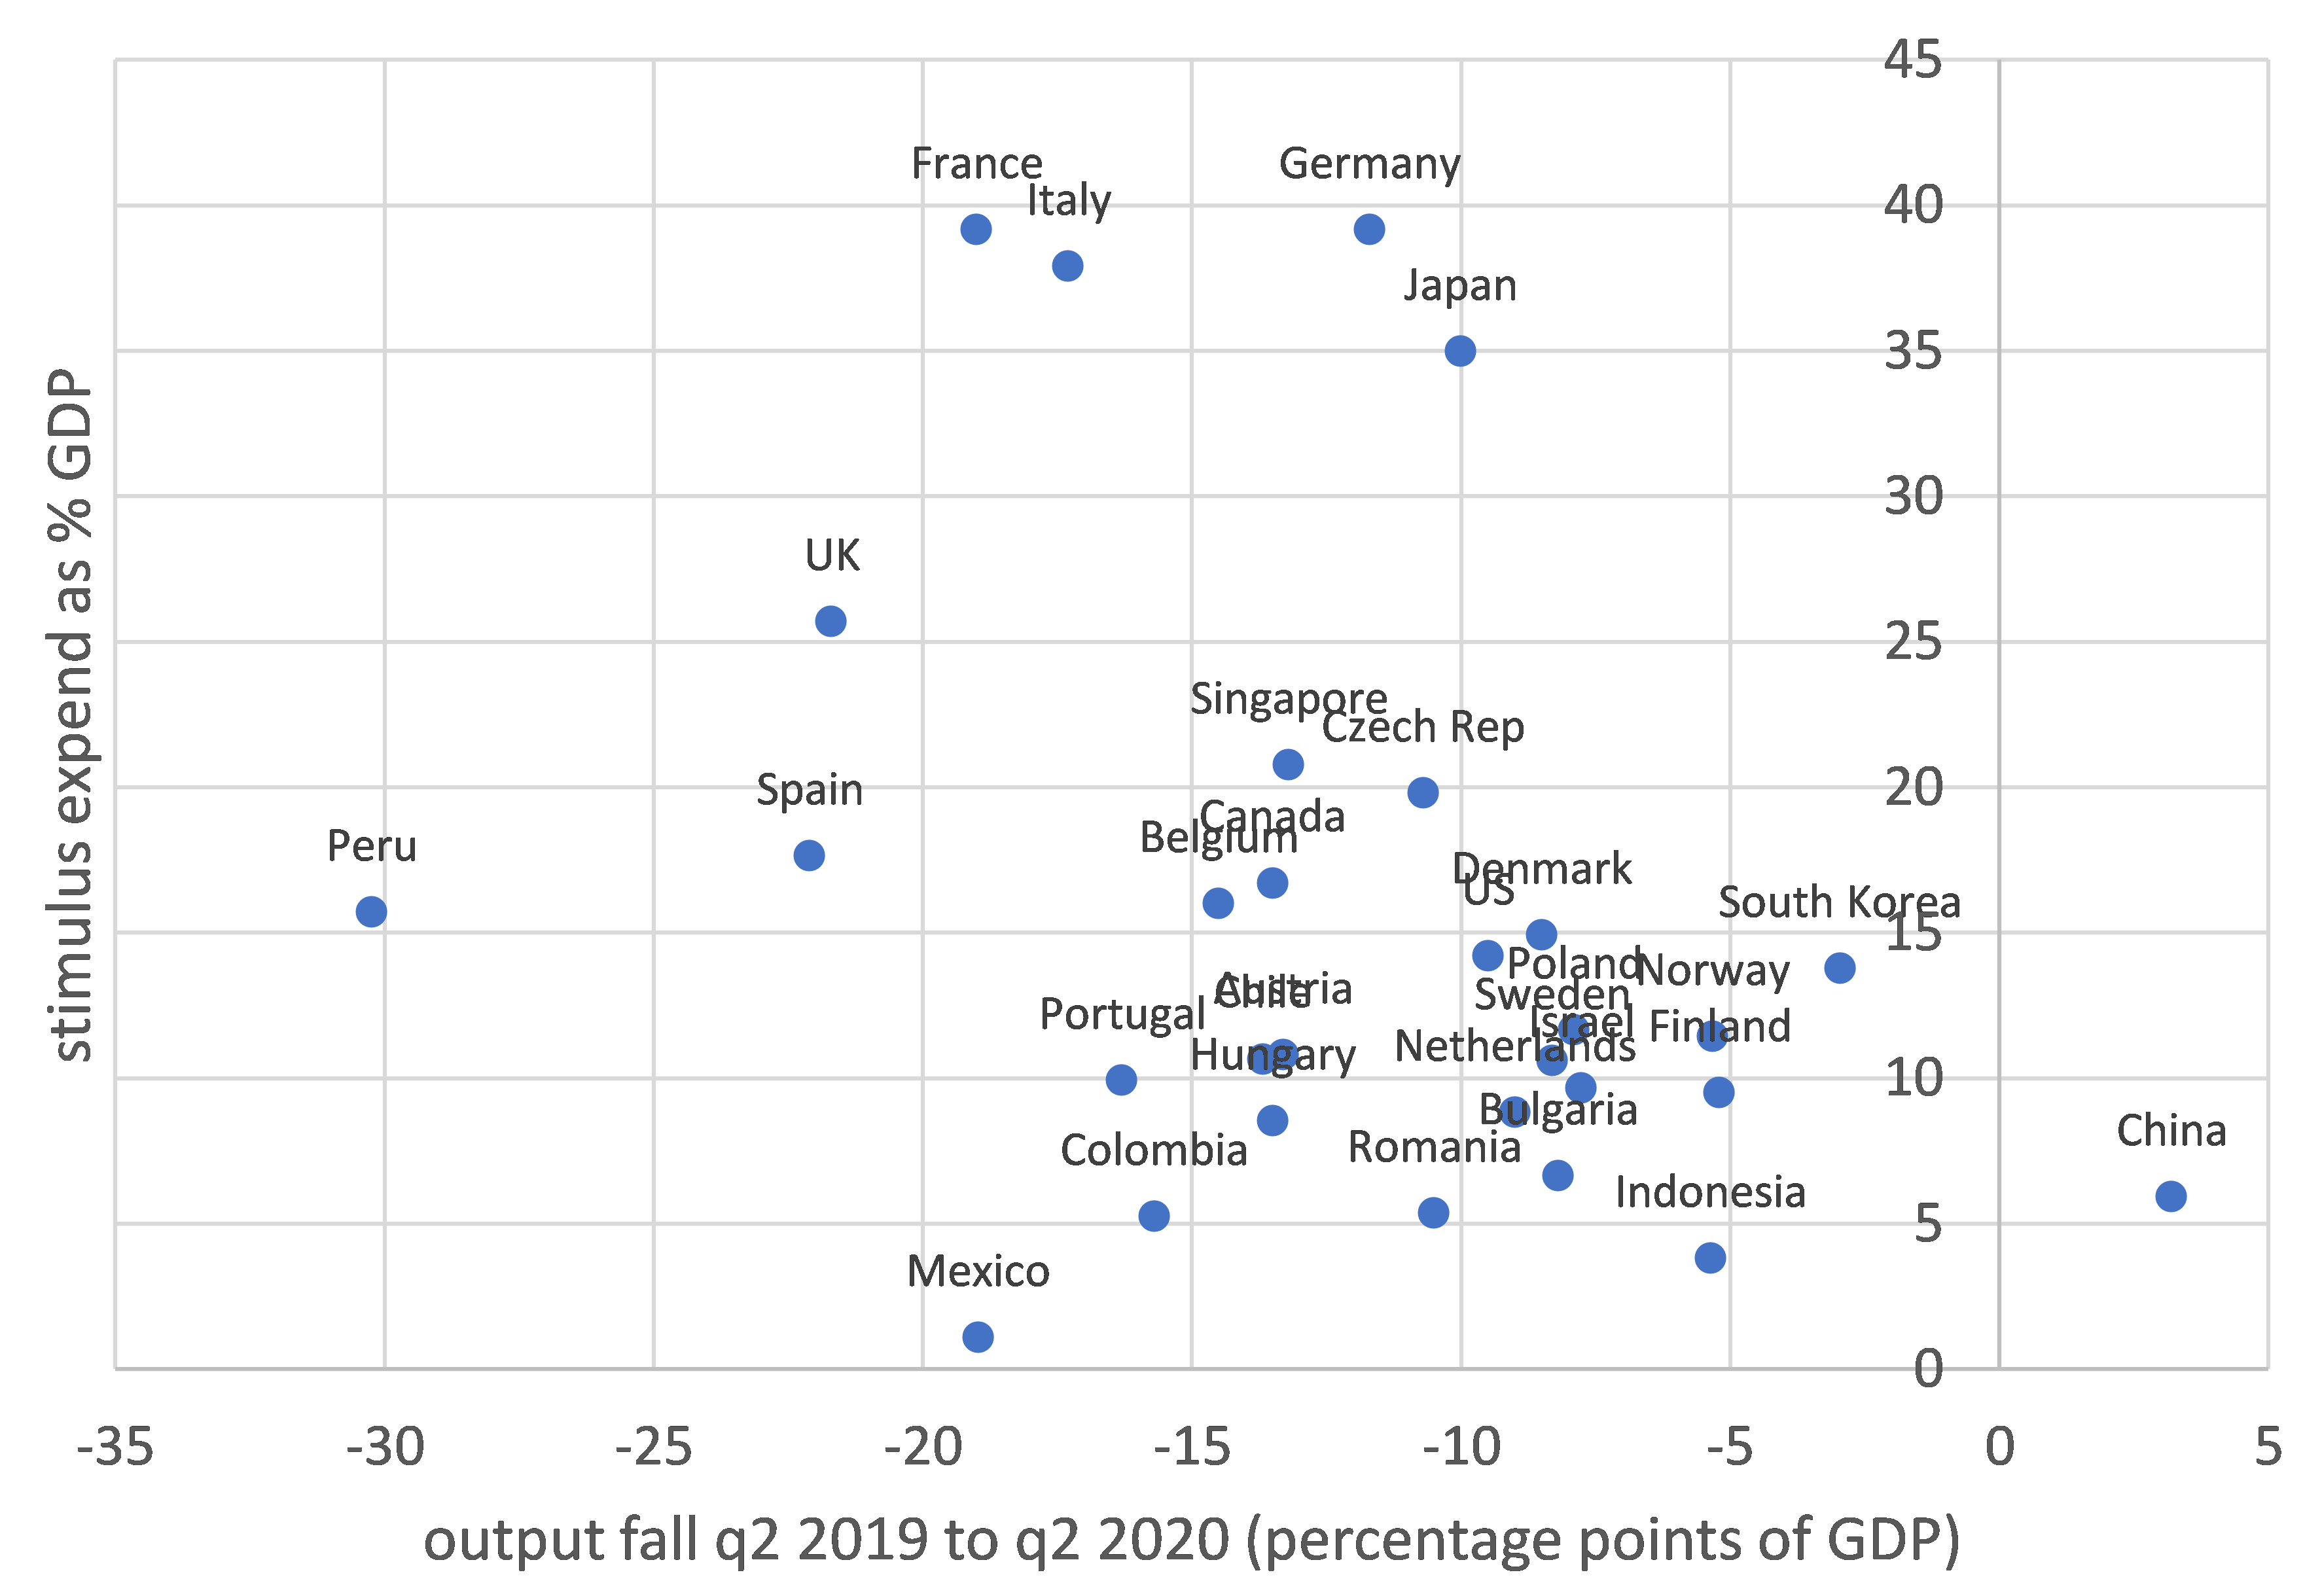
Source: Author’s calculations
Figure 3: Stimulus expenditure and output loss (advanced economies only)
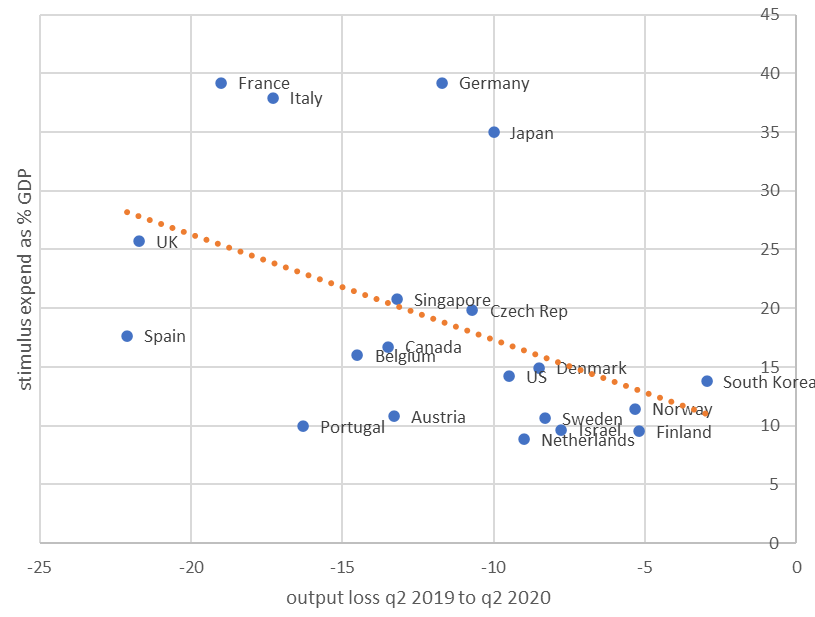
Source: Author’s calculations
Amongst the advanced economies, the correlation is considerably larger – (negative) 0.453 and the slope value was positive. Nevertheless, only 21 per cent of the changes in the size of stimulus is explained by changes in the size of output loss. Amongst the advanced economies, Germany stands out as a country that instituted substantial stimulus measures relative to output loss. It was also a country where deaths were relatively low, though the size of the stimulus response has generated some domestic criticism. The same might be said to apply to Japan, although public criticism of the government’s response seems limited.
Table 2: Data analysis of relationship between stimulus and output loss

Source: Author’s calculations
Some conclusions
Using the data available, the question of whether supressing the virus is a better strategy than trading off sacrificing lives versus sacrificing the economy remains unanswered. Moreover, it is by no means clear that the trade-off between greater emphasis on sacrificing lives or sacrificing the economy is as real as has been suggested. If such a trade-off does exist, it is, at best, a weak one.
Rather, an examination of the INET chart reproduced above indicates that countries can be ordered into a number of groups. Countries that are located close to the top right of the chart do appear to have been successful. China stands out. It acted very quickly, and it acted very firmly. Levels of compliance have been very high. However, it is highly doubtful other countries possess the infrastructure in China that facilitated high compliance. The fact that the lockdown in China was so effective reduced both losses to the economy and the need for stimulus measures.
China is, indeed, recognised as one of the few that have achieved a “V-shaped” recovery. Countries such as Korea, Norway and Finland also appear to have responded relatively well. Korea’s testing and tracing regime, derived from its experience with the earlier SARS pandemic, has been offered as an explanation for its success. Norway and Finland were both rigorous in imposing lockdowns. Indonesia is a very different society. Moreover, it is economically much less developed and its capacity to respond fiscally is much more limited. The government has been criticised for placing too much emphasis on keeping the economy open. Explaining that country’s outcome is a challenge.
A further grouping can be made of countries tending towards the bottom left of the chart. Some of these were “poor responders”. The examples of the UK and the US are often quoted. They responded too late and too haphazardly. Both have experienced high numbers of deaths. Peru is also a poor responder. Although the government there instituted a harsh early lockdown and initially spent heavily, the country has a much weaker infrastructure. It has also spent much of 2020 struggling with extreme political instability. However, this leads to the conclusion that the explanation for the position of many countries on the chart must be sui generis.
The efficiency of government responses needs examining in its own right. The strictness of Covid-19 controls has been catalogued by, for example, the Oxford Government Response Tracker. However, data from it has not yet been used to answer the questions relating to the lives versus livelihoods debate. Whether government spending and government stimulus packages have been well directed remains an open question that might be answerable ex post but has by no means been answered so far.
Last, economic loss – the variable used in the INET analysis – is a very inadequate measure for the “cost” of Covid-19. Some attempts have been made to calculate the value of the lives that have been lost because of the pandemic. These attempts have been few and far between. In their more sophisticated form, they have tried to take account of the extent to which deaths were premature, and they have placed different weights upon the age groups affected.
Nevertheless, attempts to place a value on the lives of those who have died are inadequate. Value should also include the value of the lives that have been impaired. Such impairment can take many dimensions, from mental health, to occupational scarring, to reduced lifetime income, and to the impact on families and friends of those who experienced any of these outcomes.
Moreover, until the pandemic has come to an end, even the number of deaths that have to be “priced” is unavailable – even if the cost of actions undertaken to mitigate Covid-19’s impact have already been incurred or committed. For example, the US Congressional Budget Office has estimated GDP loss at $7.6 trn. over a decade. GDP in 2019 was some $23.5 trn. The 10-year loss this represents around 35 per cent of 2019 GDP. This is some four times as large as the GDP loss recorded for the period q2 2019 to q2 2020.
As Zhou Enlai said when asked about the impact of the French Revolution, at the moment it’s “too early to say” (of course, we all know Zhou was actually referring to the events of 1968). The INET paper asked a question that deserves to be answered. That it has provoked debate is of value. However, it provides only one of the many starting points on what is likely to be a very long road.
Note: This article gives the views of the author, not the position of EUROPP – European Politics and Policy or the London School of Economics. Featured image credit: Mike Licht (CC BY 2.0)


