GLOBAL RESEARCH SYNDICATE
No Result
View All Result
  • Login
  • Latest News
  • Consumer Research
  • Survey Research
  • Marketing Research
  • Industry Research
  • Data Collection
  • More
    • Data Analysis
    • Market Insights
  • Latest News
  • Consumer Research
  • Survey Research
  • Marketing Research
  • Industry Research
  • Data Collection
  • More
    • Data Analysis
    • Market Insights
No Result
View All Result
globalresearchsyndicate
No Result
View All Result
Home Data Collection

U.S. child poverty rates reached record lows in 2019

globalresearchsyndicate by globalresearchsyndicate
November 30, 2020
in Data Collection
0
U.S. child poverty rates reached record lows in 2019
0
SHARES
1
VIEWS
Share on FacebookShare on Twitter

Misty Stanley sits with her daughters Kaylee (left) and Marabella at their home in Welch, West Virginia, on Sept. 9, 2019. McDowell County, West Virginia, is one of the poorest in the nation. (Michael S. Williamson/The Washington Post)

Before the coronavirus outbreak sent the U.S. economy into a recession, the share of American children living in poverty was on a downward trajectory, reaching record lows across racial and ethnic groups, according to a new Pew Research Center analysis of U.S. Census Bureau data.

In 2019, the year with the most recently available data, 14% of children under age 18, or 10.5 million children, were living in poverty, down from 22%, or 16.3 million, in 2010. All major racial and ethnic groups saw declines since 2010, but the greatest decreases were in the shares of Black and Hispanic children living in poverty. About two-in-ten Hispanic children (21%) were living in poverty in 2019, down from 35% in 2010. In 2019, 26% of Black children were impoverished, dropping from 39% in 2010. Even so, Black and Hispanic children were still about three times as likely as Asian (7%) and White (8%) children to be living in poverty.

In 2019, child poverty rates had dropped among all major racial and ethnic groups

Year Asian White Hispanic Black
1976 9.8% 30.2% 40.6%
1977 9.9% 28.3% 41.8%
1978 9.6% 27.6% 41.5%
1979 10.1% 28.0% 41.2%
1980 11.8% 33.2% 42.3%
1981 12.9% 35.9% 45.2%
1982 14.4% 39.5% 47.6%
1983 14.8% 38.1% 46.7%
1984 13.7% 39.2% 46.6%
1985 12.8% 40.3% 43.6%
1986 13.0% 37.7% 43.1%
1987 23.5% 11.8% 39.3% 45.1%
1988 24.1% 11.0% 37.6% 43.5%
1989 19.8% 11.5% 36.2% 43.7%
1990 17.6% 12.3% 38.4% 44.8%
1991 17.5% 13.1% 40.4% 45.9%
1992 16.4% 13.2% 40.0% 46.6%
1993 18.2% 13.6% 40.9% 46.1%
1994 18.3% 12.5% 41.5% 43.8%
1995 19.5% 11.2% 40.0% 41.9%
1996 19.5% 11.1% 40.3% 39.9%
1997 20.3% 11.4% 36.8% 37.2%
1998 18.0% 10.6% 34.4% 36.7%
1999 11.9% 9.4% 30.3% 33.2%
2000 12.7% 9.1% 28.4% 31.2%
2001 11.5% 9.5% 28.0% 30.2%
2002 11.7% 9.4% 28.6% 32.3%
2003 12.5% 9.8% 29.7% 34.1%
2004 9.9% 10.5% 28.9% 33.7%
2005 11.1% 10.0% 28.3% 34.5%
2006 12.2% 10.0% 26.9% 33.4%
2007 12.5% 10.1% 28.6% 34.5%
2008 14.6% 10.6% 30.6% 34.7%
2009 14.0% 11.9% 33.1% 35.7%
2010 14.4% 12.3% 34.9% 39.0%
2011 13.5% 12.5% 34.1% 38.8%
2012 13.8% 12.3% 33.8% 37.9%
2013 10.1% 10.7% 30.4% 38.3%
2014 14% 12.3% 31.9% 37.1%
2015 12.3% 12.1% 28.9% 32.9%
2016 11.1% 10.8% 26.6% 30.8%
2017 10.4% 10.2% 25.0% 30.4%
2018 11.3% 8.9% 23.7% 29.5%
2019 7.3% 8.3% 20.9% 26.4%

Pew Research Center

This post is based on Pew Research Center analysis of U.S. Census Bureau data on poverty in the United States, which is derived from the Current Population Survey Annual Social and Economic Supplements (ASEC).

The Census Bureau uses a set of dollar value thresholds that vary by family size and composition to determine who is in poverty. These poverty thresholds are updated annually for inflation using the Consumer Price Index for All Urban Consumers (CPI-U), and do not vary geographically. In 2019, poverty was defined as living in a household with an annual income below $25,926 for a family of four with two related children.

For this analysis, children include only those who are younger than 18. The racial and ethnic groups presented by the Census Bureau are not mutually exclusive. White children refers to non-Hispanic White children. But Black and Asian children include both their Hispanic and non-Hispanic components. Hispanic children are of any race. Before 2002, Asian children include Pacific Islanders.

The COVID-19 outbreak has affected data collection efforts by the U.S. government in its surveys, especially limiting in-person data collection. This resulted in a 10 percentage point decrease in the response rate for the March 2020 ASEC. It is possible that some measures of poverty and racial and ethnic composition are affected by these changes in data collection. For more information, see the Census Bureau’s report on the pandemic’s effect on survey response.

For more information on the source of the data and accuracy of poverty estimates, see the Census Bureau’s technical document on the CPS ASEC.

The number of impoverished children also declined across racial and ethnic groups. In particular, the numbers of poor Black and White children reached new lows in 2019 (each around 3 million). While there are about as many White children as Black children living in poverty, it’s worth noting that there are more than three times as many White children as Black children in the U.S.

About equal numbers of Black and White children are living in poverty

Year Asian White Hispanic Black
1976 4.8 1.4 3.8
1977 4.7 1.4 3.9
1978 4.5 1.4 3.8
1979 4.7 1.5 3.8
1980 5.5 1.7 4.0
1981 5.9 1.9 4.2
1982 6.6 2.2 4.5
1983 6.6 2.3 4.4
1984 6.2 2.4 4.4
1985 5.7 2.6 4.2
1986 5.8 2.5 4.1
1987 0.5 5.2 2.7 4.4
1988 0.5 4.9 2.6 4.3
1989 0.4 5.1 2.6 4.4
1990 0.4 5.5 2.9 4.6
1991 0.4 5.9 3.1 4.8
1992 0.4 6.0 3.6 5.1
1993 0.4 6.3 3.9 5.1
1994 0.3 5.8 4.1 4.9
1995 0.6 5.1 4.1 4.8
1996 0.6 5.1 4.2 4.5
1997 0.6 5.2 4.0 4.2
1998 0.6 4.8 3.8 4.2
1999 0.4 4.2 3.7 3.8
2000 0.4 4.0 3.5 3.6
2001 0.4 4.2 3.6 3.5
2002 0.3 4.1 3.8 3.6
2003 0.3 4.2 4.1 3.9
2004 0.3 4.5 4.1 3.8
2005 0.3 4.3 4.1 3.8
2006 0.4 4.2 4.1 3.8
2007 0.4 4.3 4.5 3.9
2008 0.4 4.4 5.0 3.9
2009 0.5 4.9 5.6 4.0
2010 0.5 4.9 6.1 4.4
2011 0.5 4.9 6.0 4.3
2012 0.5 4.8 6.0 4.2
2013 0.4 4.1 5.4 4.2
2014 0.5 4.7 5.7 4.1
2015 0.5 4.6 5.3 3.7
2016 0.4 4.1 4.9 3.4
2017 0.4 3.8 4.6 3.4
2018 0.5 3.3 4.4 3.3
2019 0.3 3.0 3.9 2.9

Pew Research Center

The greatest decline was in the number of Hispanic children living in poverty. In 2019, 3.9 million Hispanic children were living in poverty, down from 6.1 million impoverished Hispanic children nearly a decade earlier. But there are still more Hispanic children in poverty than any other racial or ethnic group, which has been the case since at least 2007. This is probably because Hispanics are the largest and the youngest racial or ethnic minority population in the U.S. and because the Hispanic child poverty rate is relatively high (21%). 

Children overrepresented among Black and Hispanic populations in poverty

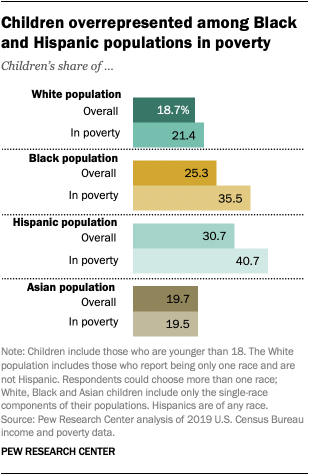
Overall, children are overrepresented among America’s impoverished population. Some 22% of the U.S. population are children, but those younger than 18 represent 31% of all Americans living in poverty.

Black and Hispanic children are particularly overrepresented. Black children represent a quarter of the Black population but 35% of all Black people living in poverty. And Hispanic children are 31% of the total Hispanic population but represent 41% of all impoverished Hispanics. In comparison, children represent about equal shares of total Asian and White populations and of impoverished Asians and Whites.

Note: This is an update of a post originally published on July 14, 2015.

Deja Thomas  is a research assistant focusing on social and demographic trends.
Richard Fry  is a senior researcher focusing on economics and education at Pew Research Center.

Related Posts

How Machine Learning has impacted Consumer Behaviour and Analysis
Consumer Research

How Machine Learning has impacted Consumer Behaviour and Analysis

January 4, 2024
Market Research The Ultimate Weapon for Business Success
Consumer Research

Market Research: The Ultimate Weapon for Business Success

June 22, 2023
Unveiling the Hidden Power of Market Research A Game Changer
Consumer Research

Unveiling the Hidden Power of Market Research: A Game Changer

June 2, 2023
7 Secrets of Market Research Gurus That Will Blow Your Mind
Consumer Research

7 Secrets of Market Research Gurus That Will Blow Your Mind

May 8, 2023
The Shocking Truth About Market Research Revealed!
Consumer Research

The Shocking Truth About Market Research: Revealed!

April 25, 2023
market research, primary research, secondary research, market research trends, market research news,
Consumer Research

Quantitative vs. Qualitative Research. How to choose the Right Research Method for Your Business Needs

March 14, 2023
Next Post
Air Cleaner Filters Market 2020-2024: Post-Pandemic Industry Planning Structure | Technavio

Air Cleaner Filters Market 2020-2024: Post-Pandemic Industry Planning Structure | Technavio

Categories

  • Consumer Research
  • Data Analysis
  • Data Collection
  • Industry Research
  • Latest News
  • Market Insights
  • Marketing Research
  • Survey Research
  • Uncategorized

Recent Posts

  • Ipsos Revolutionizes the Global Market Research Landscape
  • How Machine Learning has impacted Consumer Behaviour and Analysis
  • Market Research: The Ultimate Weapon for Business Success
  • Privacy Policy
  • Terms of Use
  • Antispam
  • DMCA

Copyright © 2024 Globalresearchsyndicate.com

Welcome Back!

Login to your account below

Forgotten Password?

Retrieve your password

Please enter your username or email address to reset your password.

Log In
This website uses cookies to improve your experience. We'll assume you're ok with this, but you can opt-out if you wish. Cookie settingsACCEPT
Privacy & Cookies Policy

Privacy Overview

This website uses cookies to improve your experience while you navigate through the website. Out of these cookies, the cookies that are categorized as necessary are stored on your browser as they are essential for the working of basic functionalities of the website. We also use third-party cookies that help us analyze and understand how you use this website. These cookies will be stored in your browser only with your consent. You also have the option to opt-out of these cookies. But opting out of some of these cookies may have an effect on your browsing experience.
Necessary
Always Enabled
Necessary cookies are absolutely essential for the website to function properly. This category only includes cookies that ensures basic functionalities and security features of the website. These cookies do not store any personal information.
Non-necessary
Any cookies that may not be particularly necessary for the website to function and is used specifically to collect user personal data via analytics, ads, other embedded contents are termed as non-necessary cookies. It is mandatory to procure user consent prior to running these cookies on your website.
SAVE & ACCEPT
No Result
View All Result
  • Latest News
  • Consumer Research
  • Survey Research
  • Marketing Research
  • Industry Research
  • Data Collection
  • More
    • Data Analysis
    • Market Insights

Copyright © 2024 Globalresearchsyndicate.com