
DASH Price Analysis – December 14
DASH/USD is in a sideways trend after a downward move. The bearish trend has been exhausted as the coin resumes sideways trend. DASH/BTC has been in a sideways trend since September.
DASH/USD Market
Key Levels:
Resistance Levels: $80, $100, $120
Support Levels: $50, $30, $10
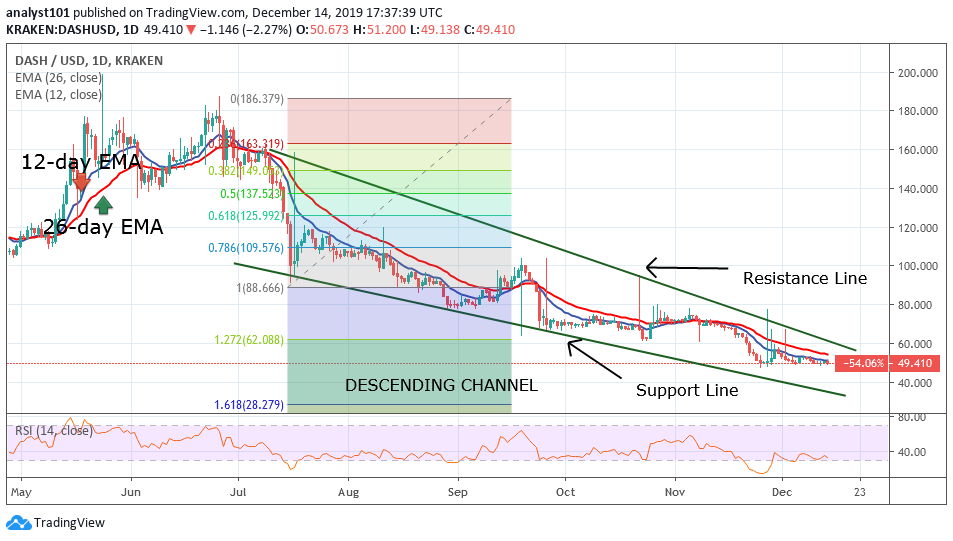
DASH/USD pair is presently in a sideways trend as the coin falls to the low of $48. In retrospect, DASH was previously in a bear market. In May and June, the bulls made frantic efforts to break the overhead resistance at $180 but were unsuccessful. In the process of time, a bearish triple top pattern was formed. The price pattern triggered the bear market.
From the Fibonacci tool, it indicates that DASH is likely to trade and reverse at the 1.272 extension level. This is equivalent to a $60 price level. The Relative Strength Index period 14 level35 indicates that the coin is approaching the oversold region. The pair is currently fluctuating above the $50 price level. Nevertheless, if the price breaks below the support line, DASH risks further depreciation. Conversely, DASH will move upward, if the bulls break above the resistance line.
DASH/BTC Market
On the DASH/BTC chart, the coin was previously in a bear market. It is now in a sideways trend fluctuating between the levels of Ƀ0.007000 and Ƀ0.01000. The bulls made an upward move to test the resistance at Ƀ0.010000 but were resisted.
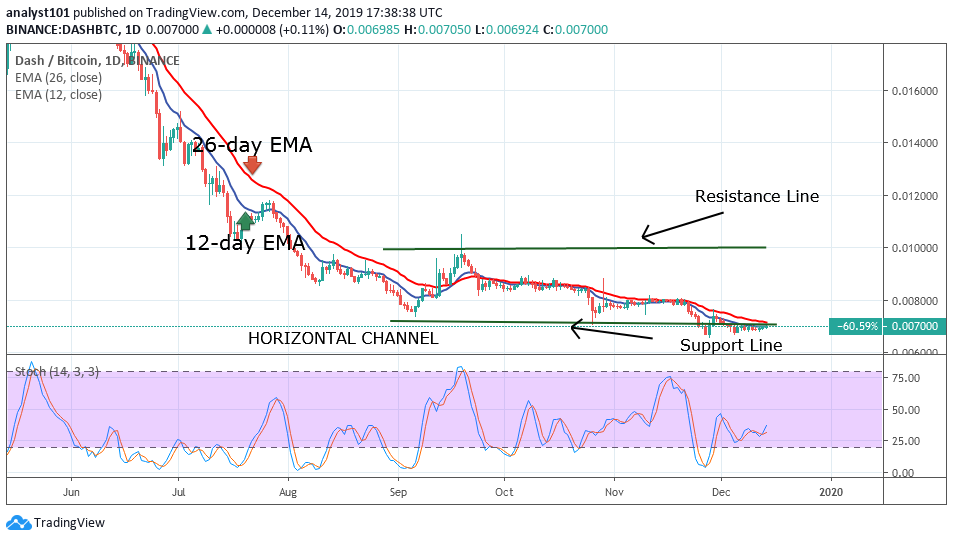
However, the bears made several attempts at the support and it is consolidating at the bottom of the chart. Meanwhile, the stochastic indicates that the price is above 25% range of the daily stochastic. This implies that the coin is in a bullish momentum.
Please note: Cryptovibes.com is not a financial advisor. Do your research before investing your funds in any financial asset or presented product or event. We are not responsible for your investing results.


