
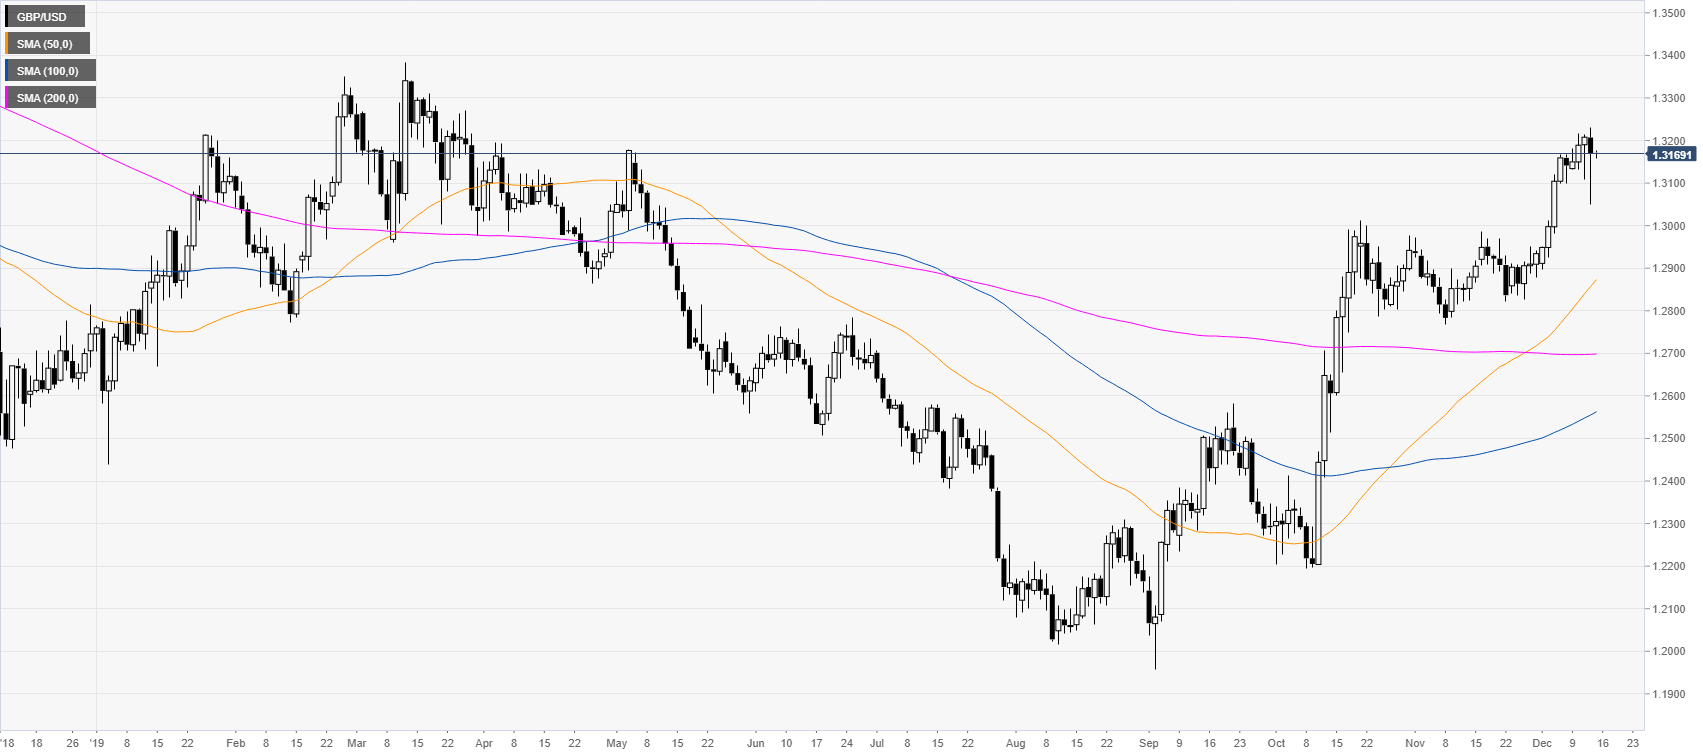
GBP/USD daily chart
The spot is easing from eight-month highs trading just below the 1.3200 handle. The underlying tone remains bullish while above the main daily SMAs. Extreme volatility is expected on UK’s election day.
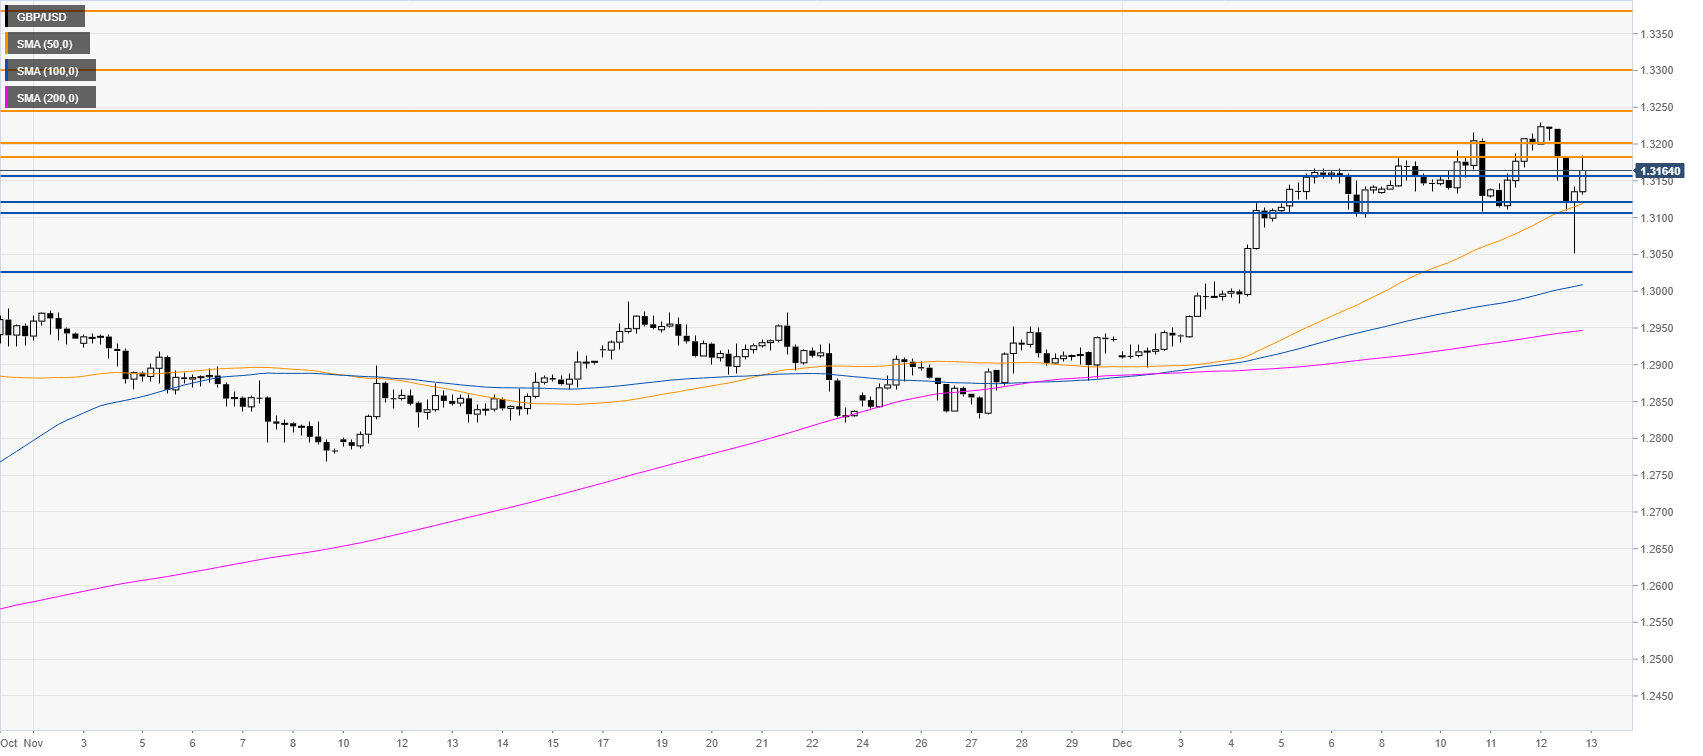
GBP/USD four-hour chart
GBP/USD is trading above the main SMAs, suggesting a bullish momentum in the medium term. The key level to beat for bulls will be the 1.3244 level, which can open the way to the 1.3300 handle and the 1.3384 resistance on the way up, according to the Technical Confluences Indicator.
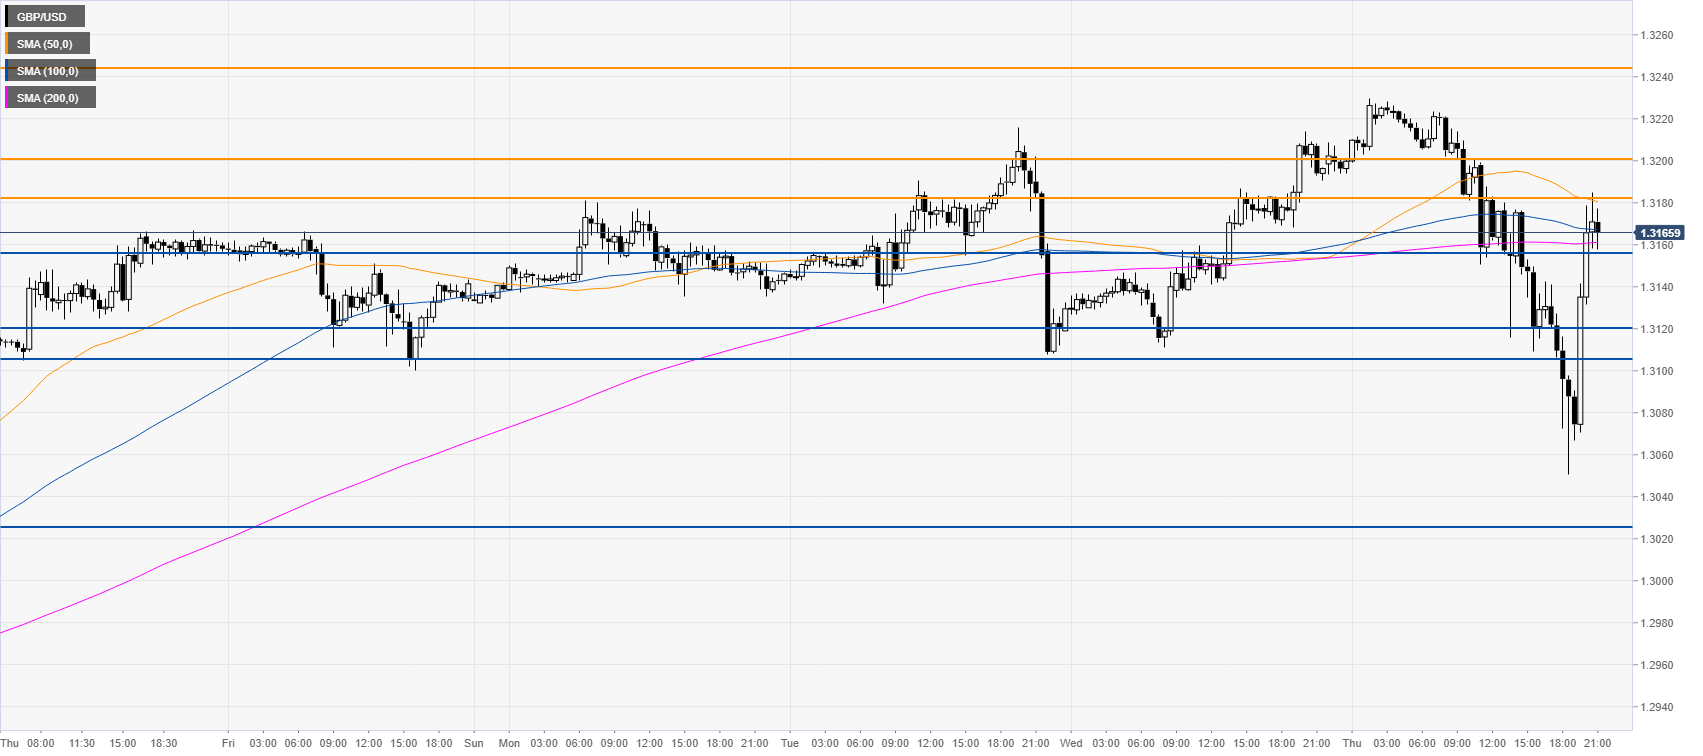
GBP/USD 30-minute chart
The spot is trading above the 1.3160 level and the 200 SMA below the main SMAs. Support is seen at the 1.3160 and 1.3120/06 level. Further down lie the 1.3025 level, according to the Technical Confluences Indicator.
Additional key levels


