Abstract
Background
Chronic kidney disease (CKD) measures (estimated glomerular filtration rate [eGFR] and albuminuria) are frequently assessed in clinical practice and improve the prediction of incident cardiovascular disease (CVD), yet most major clinical guidelines do not have a standardized approach for incorporating these measures into CVD risk prediction. “CKD Patch” is a validated method to calibrate and improve the predicted risk from established equations according to CKD measures.
Methods
Utilizing data from 4,143,535 adults from 35 datasets, we developed several “CKD Patches” incorporating eGFR and albuminuria, to enhance prediction of risk of atherosclerotic CVD (ASCVD) by the Pooled Cohort Equation (PCE) and CVD mortality by Systematic COronary Risk Evaluation (SCORE). The risk enhancement by CKD Patch was determined by the deviation between individual CKD measures and the values expected from their traditional CVD risk factors and the hazard ratios for eGFR and albuminuria. We then validated this approach among 4,932,824 adults from 37 independent datasets, comparing the original PCE and SCORE equations (recalibrated in each dataset) to those with addition of CKD Patch.
Findings
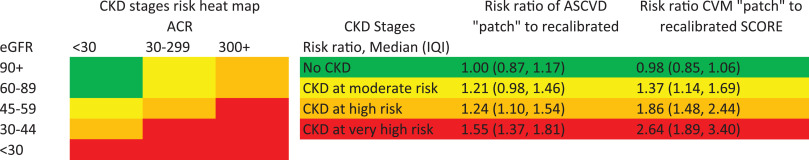
We confirmed the prediction improvement with the CKD Patch for CVD mortality beyond SCORE and ASCVD beyond PCE in validation datasets (Δc-statistic 0.027 [95% CI 0.018–0.036] and 0.010 [0.007–0.013] and categorical net reclassification improvement 0.080 [0.032–0.127] and 0.056 [0.044–0.067], respectively). The median (IQI) of the ratio of predicted risk for CVD mortality with CKD Patch vs. the original prediction with SCORE was 2.64 (1.89–3.40) in very high-risk CKD (e.g., eGFR 30–44 ml/min/1.73m2 with albuminuria ≥30 mg/g), 1.86 (1.48–2.44) in high-risk CKD (e.g., eGFR 45–59 ml/min/1.73m2 with albuminuria 30–299 mg/g), and 1.37 (1.14–1.69) in moderate risk CKD (e.g., eGFR 60–89 ml/min/1.73m2 with albuminuria 30–299 mg/g), indicating considerable risk underestimation in CKD with SCORE. The corresponding estimates for ASCVD with PCE were 1.55 (1.37–1.81), 1.24 (1.10–1.54), and 1.21 (0.98–1.46).
Interpretation
The “CKD Patch” can be used to quantitatively enhance ASCVD and CVD mortality risk prediction equations recommended in major US and European guidelines according to CKD measures, when available.
Funding
US National Kidney Foundation and the NIDDK.
Keywords
Evidence before this study
We searched PubMed on January 22, 2020 for articles relating to the two key chronic kidney disease (CKD) measures (estimated glomerular filtration rate [eGFR] and albuminuria) using the following terms: (“glomerular filtration rate” or “GFR” or “kidney function”) and (“albuminuria” or “proteinuria” or “ACR” or “PCR” or “dipstick”) and (“cardiovascular events” or “cardiovascular outcomes” or “cardiovascular mortality” or “myocardial infarction” or “stroke” or “atherosclerotic cardiovascular disease”) and (“prediction” or “discrimination” or “calibration” or “c-statistic” or “net reclassification”). Also, we sought feedback on relevant articles form co-authors. Although we found several studies reporting that these CKD measures improved cardiovascular risk prediction, we did not find any studies displaying a specific approach to incorporate CKD measures into established risk prediction models in major clinical guidelines (i.e., the Pooled Cohort Equation [PCE] and SCORE).
Added value of this study
Utilizing data from 4,143,535 adults from 35 datasets, we developed several CKD Patches (tools to enhance predicted risk according to the deviation between an individual’s CKD measures and the values expected from their traditional CVD risk factors and the hazard ratios for eGFR and albuminuria) incorporating eGFR and albuminuria, to enhance prediction of risk of atherosclerotic cardiovascular disease (ASCVD) by PCE and CVD mortality by SCORE. In 37 validation datasets including 4,932,824 adults, CKD Patch improved the prediction for CVD mortality beyond SCORE and ASCVD beyond PCE (Δc-statistic 0.027 [95% CI 0.018–0.036] and 0.010 [0.007–0.013] and categorical net reclassification improvement 0.080 [0.032–0.127] and 0.056 [0.044–0.067], respectively). In very high risk CKD (e.g., eGFR 30–44 ml/min/1.73m2 with urine albumin-to-creatinine ratio ≥30 mg/g), the median (IQI) ratio of risk prediction according to the CKD Patch compared to the original equations was 1.55 (1.37–1.81) for ASCVD and 2.64 (1.89–3.40) for CVD mortality.
Implications of all the available evidence
1. Introduction
]. Among these, cardiovascular disease (CVD) is particularly important as the leading cause of death in persons with CKD [
]. A number of studies have shown that the key measures of CKD, estimated glomerular filtration rate (eGFR) and albuminuria, are strongly associated with CVD outcomes and can statistically significantly improve the risk prediction of incident CVD beyond traditional CVD risk factors [
,
]. Importantly, eGFR and albuminuria are readily available in many patients.
- Piepoli M.F.
- Hoes A.W.
- Agewall S.
- Albus C.
- Brotons C.
- Catapano A.L.
- et al.
]. This approach does not account for other risk factors and therefore may misclassify the risk. Furthermore, this ESC Guideline does not address albuminuria in those without diabetes as a predictor of CVD risk [
].
Importantly, both AHA/ACC and ESC Guidelines have their own risk prediction equations (the Pooled Cohort Equation [PCE] and Systematic COronary Risk Evaluation [SCORE], respectively), which are widely used in primary care settings to guide CVD preventive therapies (e.g., statins). Because CKD measures were not evaluated in the dataset from which PCE and SCORE were derived, these measures cannot be simply incorporated into these risk prediction equations.
], we developed and validated several “CKD patches” to enhance the predicted CVD risk calculated from PCE and SCORE according to CKD measures. Developing CKD Patches in this meta-analysis which includes ∼9 million adults from 72 datasets from various countries has the key advantage of improved generalizability.
2. Methods
This study was approved for use of de-identified data by the institutional review board at the Johns Hopkins Bloomberg School of Public Health, Baltimore, Maryland, USA (#IRB00003324). The need for informed consent was waived by the institutional review board.
2.1 Study populations
], but in brief, this consortium included both research cohorts and health system datasets, with participants from 41 countries from North America, Europe, the Middle East, Asia, and Australia. These cohorts included general population, high-risk (specifically selected for clinical conditions, such as diabetes), and CKD (exclusively enrolling individuals with CKD) cohorts. We studied participants aged 30 years or older without prevalent CVD at baseline. Each cohort was required to be informative, defined as having at least four years of follow-up among 75% of participants and at least 50 incident CVD outcomes of interest.
2.2 CKD measures
]. eGFR was calculated by the CKD Epidemiology Collaboration creatinine equation [
]. Albuminuria was primarily measured as spot urine albumin-to-creatinine ratio (ACR), as recommended in clinical guidelines [
], with secondary analyses utilizing dipstick proteinuria as an alternative measure.
2.3 Traditional CVD predictors
2.4 CVD outcomes
,
]. ASCVD included coronary heart disease (CHD) (myocardial infarction and fatal CHD) and stroke as a composite outcome [
]. Consistent with the SCORE model, we analyzed CHD mortality and non-CHD CVD mortality separately [
]. Details about how each cohort defined ASCVD and CVD mortality are summarized in Web Appendix 1.
2.5 Statistical analysis
,
], we analyzed each cohort separately and then pooled the estimates using random-effects models.
Among the 72 cohorts, 35 cohorts were selected as development datasets because they were able to share de-identified individual-level data with the CKD-PC Data Coordinating Center and represented a broad range of populations, including the general population. The remaining 37 cohorts were either unable to share individual-level data or included highly selected samples (e.g., persons with CKD), and were thus considered validation datasets. One exception was the OptumLabs® Data Warehouse (OLDW) datasets; half were randomly selected to be validation datasets in order to have good representation of health system databases in validation.
]. Briefly, there are three steps in the development of the CKD Patch: 1) a linear regression equation was developed to estimate “expected” values of eGFR and log-ACR conditional on the traditional CVD predictors defined above; 2) hazard ratios for the CVD outcomes of interest were estimated for eGFR (with linear spline terms and knots at 60 and 90 ml/min/1.73m2 [major thresholds of CKD vs. no CKD and reduced vs. normal eGFR, respectively]) [
] and log-ACR, adjusted for the traditional CVD predictors; and 3) the CVD risk estimate was multiplied by the deviation between observed and expected eGFR and log-ACR and their hazard ratios for each individual. In the second step, log hazard ratios for the traditional CVD predictors were fixed according to the original PCE [
] or SCORE [
] coefficients. To match the method used in each original equation, we used Cox models with follow-up time as a time scale for the analysis of ASCVD as in PCE [
] and Weibull models with age as a time scale for the analysis of CVD mortality as in SCORE [
].
]. However, to reflect current clinical settings where eGFR is more commonly available than albuminuria, we first developed the GFR Patch. Subsequently, the ACR Patch was added to the GFR Patch, comprising a “CKD Patch.” As a sensitivity analysis, we also developed CKD Patch including eGFR and dipstick proteinuria.
]. In CKD cohorts, since expected values from non-CKD cohorts at given levels of traditional predictors were found to overestimate eGFR and underestimate albuminuria, instead of intercept from the linear regression model from the development datasets, we centered expected eGFR and albuminuria at the cohort-specific average.
], Harrel’s c-statistic (a measure of risk discrimination accounting for censoring) [
], and categorical net reclassification improvement (NRI) [
]. The 95% confidence intervals of c-statistics and NRI were calculated using a normal approximation.
2.6 Role of the funding source
The funders had no role in the study design, data collection, analysis, data interpretation, or writing of the report. KM and JC had full access to all analyses and all authors had final responsibility for the decision to submit for publication, informed by discussions with collaborators.
3. Results
3.1 Study characteristics
Table 1Baseline characteristics for development and validation datasets.
* N for ACR or dipstick are a subset of the cohorts. ACR: urine albumin to creatinine ratio; eGFR: estimated glomerular filtration rate.
Predictor profiles varied considerably across cohorts among the development datasets. For example, the prevalence of antihypertensive medication use ranged from 17% to 77%, which was related to cohort mean age (Pearson correlation 0.76). Datasets from Asia and some from Europe had higher proportions of current smokers than other datasets. Although several validation datasets had a high burden of risk factors by design (e.g., 100% diabetes in a few datasets), the summary characteristics were similar between development datasets and validation datasets.
3.2 Performance of the PCE and score
Table 2Meta-analyzed hazard ratios (95% CI) in development datasets.
ACR: urine albumin to creatinine ratio; ASCVD: atherosclerotic cardiovascular disease; CHD: coronary heart disease; CVD: cardiovascular disease; eGFR: estimated glomerular filtration rate.
Bold indicates statistical significance at p<0.05.
Table 3C-statistics and NRI for ASCVD and CVM in validation datasets.
ASCVD: atherosclerotic cardiovascular disease; CKD: chronic kidney disease; CVM: cardiovascular mortality; eGFR: estimated glomerular filtration rate; NRI: net reclassification improvement.

Fig. 1Enhancement of ASCVD and CVM risk by CKD status. ACR: urine albumin to creatinine ratio; ASCVD: atherosclerotic cardiovascular disease; CKD: chronic kidney disease; CVM: cardiovascular disease mortality; eGFR: estimated glomerular filtration rate. eGFR in ml/min/1.73m2 and ACR in mg/g.
3.3 Development of CKD patch
]. Higher ACR was linearly associated with both ASCVD and CVD mortality. Elevated dipstick proteinuria categories were associated with higher ASCVD risk, but were less consistent for CVD mortality. Overall, as reported previously [
], both eGFR and ACR demonstrated stronger associations with CVD mortality than with ASCVD.
In the linear regression models to estimate “expected” levels of CKD measures, age, total cholesterol, high-density lipoprotein cholesterol, systolic blood pressure, the use of antihypertensive medication, current smoking, diabetes, and black race were all statistically significantly associated with eGFR levels (Web Table 6). ACR was also associated with all of these factors except black race. Gender was associated with ACR but not eGFR. The models for estimating “expected” eGFR and log-ACR were similar in datasets used for developing the “CKD Patch” for ASCVD and CVD mortality (Web Table 6).
Using these estimates, we constructed the “CKD Patch” for ASCVD and CVD mortality separately.
3.4 Performance of CKD patch in validation datasets
The CKD Patch with eGFR and dipstick proteinuria also improved prediction of ASCVD and CVD mortality in the validation datasets (Web Tables 9 and 10). Improvements in validation cohorts were similar to those in the development cohorts (Web Tables 11 and 12).
3.5 Absolute risk estimates using the CKD patch with the PCE or score equations
], indicating considerable ASCVD risk underestimation in CKD by PCE. The corresponding ratios were even greater for CVD mortality by SCORE, with a median of 2.64 (1.89–3.40) for very high, 1.86 (1.48–2.44) for high, and 1.37 (1.14–1.69) for moderate risk CKD. The percentage of individuals with eGFR 2 classified at very high risk for CVD mortality (>10% in 10 years) increased from 30.9% to 53.5% by adding the eGFR patch to the recalibrated SCORE, compared to 14.2% and 29.0% for the original SCORE for low- and high-risk countries (Web Table 14).
4. Discussion
There are several key findings from this study. First, after recalibration, PCE and SCORE showed good discrimination across the cohorts in our global Consortium. Second, the “CKD Patch” improved discrimination and CVD risk classification beyond recalibrated PCE for ASCVD and recalibrated SCORE for CVD mortality. Third, the improvement by the CKD Patch was generally more evident for CVD mortality prediction than for ASCVD prediction. Fourth, as expected and now quantified, the impact on CVD risk was larger at lower eGFR and higher ACR (defined by KDIGO as higher risk CKD categories). Finally, the calibration of the original PCE and SCORE equations varied markedly across a broad range of international datasets.
]. Importantly, unlike most non-traditional predictors, eGFR is routinely assessed in clinical practice (e.g., hundreds of millions of tests of serum creatinine are conducted annually in the USA), and the assessment of albuminuria is a non-invasive test recommended for individuals with diabetes, hypertension, and CKD by major clinical guidelines. Thus, instead of a typical question of whether it is worth additionally measuring non-traditional predictors, the question for CKD measures is whether healthcare providers should ignore readily available information on CKD measures in CVD risk prediction. Our results clearly indicate that the answer is no.
]. These observations have biological plausibility since left ventricular hypertrophy [
] and accompanying diastolic dysfunction have been recognized as the most common cardiac phenotype related to CKD [
], and these conditions can lead to development of heart failure, a condition with high mortality.
]. This observation is not surprising since the incidence rate of CVD varies substantially by factors beyond traditional predictors, such as socioeconomic status, lifestyle, region/country, and calendar year. Different methods have been proposed to optimize calibration, e.g., recalibrating an existing equation [
] or developing a unique equation to specific regions/countries [
] or clinical groups (e.g., diabetes) [
]. Alternatively, a few groups have proposed a method to utilize national data to tailor risk prediction for each country [
,
]. A limitation of all approaches is that incidence rates often change over time due to various reasons (e.g., the development of novel therapies).
There are several limitations of this study. The assessment of CKD measures and traditional risk factors was not fully standardized across cohorts. Similarly, the ascertainment and definitions of CVD were not identical across cohorts. We relied on an assessment of eGFR and albuminuria at a single timepoint. Also, we did not have information on primary causes of CKD. In addition, the validation datasets were not necessarily randomly selected. However, our validation datasets with varying study characteristics seem actually conservative and advantageous in terms of generalizability. Although our cohorts represent 41 countries, we have only a few cohorts that include participants from South America, the Middle East, and Australia, and no cohorts from Africa. The complete case data analysis can be also viewed as a limitation. However, the results were largely consistent in research cohorts and clinical database studies; mechanisms of missing data can be considerably different in these two study types (typically sicker populations tend to have missing data in research cohorts, whereas clinical databases will oversample sicker populations who are more likely to have more laboratory measurements).
In conclusion, eGFR and albuminuria enhance CVD risk prediction. The “CKD Patch” developed in this study enables objective calibration of CVD risk in CKD at higher risk, defined by lower eGFR and higher albuminuria, and improvement of two major existing prediction models, the PCE for ASCVD and SCORE for CVD mortality.
Data sharing statement
Contributors
K.M. and J.C. had full access to all the data in the study and take responsibility for the integrity of the data and the accuracy of the data analysis. K.M. and J.C. were responsible for the study concept and design. K.M., Y.S., S.H.B., M.E.G., A.S., and J.C with the CKD-PC investigators/collaborators listed below were involved in the acquisition of data. All the authors contributed to the analysis and interpretation of data and to the critical revision of the manuscript for important intellectual content. K.M., S.K.J., Y.S., S.H.B., E.S., and J.C. drafted the manuscript. K.M. and J.C. guarantee the integrity of the work. The corresponding author attests that all listed authors meet authorship criteria and that no others meeting the criteria have been omitted.
Funding
The CKD-PC Data Coordinating Center is funded in part by a program grant from the US National Kidney Foundation (NKF funding sources include Janssen and Boehringer Ingelheim) and the National Institute of Diabetes and Digestive and Kidney Diseases ( R01DK100446 ). A variety of sources have supported enrollment and data collection including laboratory measurements, and follow-up in the collaborating cohorts of the CKD-PC (eAppendix 3). These funding sources include government agencies such as national institutes of health and medical research councils as well as foundations and industry sponsors. The funders of the study had no role in the design and conduct of the study; collection, management, analysis, and interpretation of the data; preparation, review, or approval of the manuscript; and decision to submit the manuscript for publication. In addition, the funders had no right to veto publication or to control the decision regarding to which journal the paper would be submitted.
Declaration of Competing Interest
Dr. Matsushita reports grants from NIH during the conduct of the study; grants and personal fees from Kyowa Kirin and personal fees from Akebia outside the submitted work. Dr. Grams reports grants from NKF and grants from NIH during the conduct of the study and received travel funds to speak at DCI Director’s meeting. Dr. Ärnlöv reports personal fees from AstraZeneca outside the submitted work. Dr. Ebert reports personal fees from Bayer AG, personal fees from Siemens Healthineers, and personal fees from Roche Diagnostics outside the submitted work. Dr. Eckardt reports grants from Astra Zeneca, grants from Bayer, grants from FMC, and grants from Vifor during the conduct of the study; personal fees from Akebia, personal fees from Astellas, personal fees from Bayer, and personal fees from Vifor outside the submitted work. Dr. Gutierrez reports grants and personal fees from Akebia, grants and personal fees from Amgen, grants from GSK, personal fees from QED, grants from National Institutes of Health, and grants from American Heart Association outside the submitted work. Dr. Kovesdy reports personal fees from Amgen, personal fees from Sanofi-Aventis, personal fees from Fresenius Medical Care, personal fees from Keryx, grants from Shire, personal fees from Bayer, personal fees from Abbott, personal fees from Abbvie, personal fees from Dr. Schar, personal fees from Astra-Zeneca, personal fees from Takeda, personal fees from Tricida, and personal fees from Reata outside the submitted work. Dr. Levey reports grants from NIDDK during the conduct of the study. Dr. Lloyd-Jones reports grants from NIH during the conduct of the study. Dr. Muntner reports grant support and consulting fees unrelated to this project. Dr. Nadkarni reports grants, personal fees, non-financial support and other from Renalytix AI, non-financial support and other from Pensieve Health, personal fees from Reata, personal fees from AstraZeneca, and personal fees from GLG Consulting outside the submitted work. Dr. Ohkubo reports grants from Omron Healthcare Co. Ltd. outside the submitted work. Dr. Shlipak reports consultancy fees from Cricket Health and Intercept Pharmaceuticals and stocks/stock options from TAI Diagnostics where he is a Scientific Advisor outside the submitted work. Dr. Woodward reports personal fees from Amgen and personal fees from Kirin outside the submitted work. Dr. Zhang reports grants from National Natural Science Foundation of China, grants from Beijing Nova Program Interdisciplinary Cooperation Project, grants from University of Michigan Health System-Peking University Health Science Center Joint Institute for Translational and Clinical Research, grants from PKU-Baidu Fund, grants from Peking University, and grants from AstraZeneca during the conduct of the study. Dr. Schaeffner reports other from Siemens Healthineers, other support from Fresenius Kabi and other support from Fresenius Medical Care outside the submitted work. Dr. Coresh reports grants from NIH and grants from National Kidney Foundation during the conduct of the study; personal fees and other support from Healthy.io outside the submitted work. All other coauthors have nothing to disclose.
Acknowledgments
CKD-PC investigators/collaborators (cohort acronyms/abbreviations are listed in eAppendix 2 in the Supplement:
ADVANCE: John Chalmers, Mark Woodward; Aichi: Hiroshi Yatsuya, Koji Tamakoshi, Yuanying Li, Yoshihisa Hirakawa; ARIC: Josef Coresh, Kunihiro Matsushita, Jung-Im Shin, Junichi Ishigami; AusDiab: Kevan Polkinghorne, Steven Chadban, Robert Atkins; BIS: Elke Schaeffner, Natalie Ebert, Dörte Huscher; CARDIA: Donald Lloyd-Jones, Orlando M. Gutierrez; China NS: Luxia Zhang, Minghui Zhao, Fang Wang, Bixia Gao, Jinwei Wang; CHS: Michael Shlipak, Nisha Bansal; CIRCS: Hiroyasu Iso, Kazumasa Yamagishi, Isao Muraki, Yasuhiko Kubota; COBRA: Tazeen Jafar, Imtiaz Jehan, Neil Poulter, Nish Chaturvedi; CRIC: Jiang He, Wei Yang, Matthew Weir, Stephanie Toth-Manikowski, Christopher Jepson; ESTHER: Hermann Brenner, Dietrich Rothenbacher, Ben Schöttker, Bernd Holleczek; Framingham: Daniel Levy, Shih-Jen Hwang; GCKD: Markus P. Schneider, Anna Köttgen, Heike Meiselbach, Kai-Uwe Eckardt; Geisinger: Alex R. Chang, Gurmukteshwar Singh, Jamie Green, H. Lester Kirchner; Gubbio: Massimo Cirillo; Hong Kong CKD: Angela Yee-Moon Wang, Hoi Ching Cheung, Hailey Yee Tsui, Victoria Ngai; IPHS: Fujiko Irie, Toshimi Sairenchi; JHS: Adolfo Correa, Casey M. Rebholz, Bessie Young, L. Ebony Boulware; LCC: Nigel Brunskill, Laura Gray, Rupert W. Major, James Medcalf; Maccabi: Varda Shalev, Gabriel Chodick; MESA: Michael Shlipak; Mt Sinai BioMe: Girish N. Nadkarni, Erwin P. Bottinger, Ruth J.F. Loos, Stephen B. Ellis; NEFRONA: José M. Valdivielso, Marcelino Bermúdez-López, Milica Bozic, Serafí Cambray; NHANES: Yingying Sang; NIPPON DATA80 & NIPPON DATA90: Hirotsugu Ueshima, Akira Okayama, Tomonori Okamura, Katsuyuki Miura; Ohasama: Takayoshi Ohkubo, Hirohito Metoki, Michihiro Satoh, Masahiro Kikuya; OLDW: John Cuddeback, Elizabeth Ciemins, Emily Carbonara, Stephan Dunning; PREVEND: Ron T. Gansevoort, Lyane M. Kieneker, Stephan J.L. Bakker, Hans L. Hillege, Pim van der Harst; Rancho Bernardo: Simerjot K. Jassal, Jacklyn Bergstrom, Joachim Ix; RCAV: Csaba P. Kovesdy, Keiichi Sumida, Miklos Z. Molnar, Praveen Potukuchi; REGARDS: Orlando M. Gutierrez, Paul Muntner, David Warnock; RENAAL: Dick de Zeeuw, Michelle J. Pena, Hiddo J.L. Heerspink; SEED: Tien Yin Wong, Charumathi Sabanayagam, Ching-Yu Cheng, Rehena Sultana; SKS: Philip Kalra, Rajkumar Chinnadurai, James Tollitt, Darren Green; SMART: Frank Visseren, Joep van der Leeuw; Sunnybrook: David Naimark, Navdeep Tangri; Taiwan MJ: Chi-Pang Wen, Min-Kuang Tsai; Takahata: Takamasa Kayama, Tsuneo Konta; TLGS: Mohammadhassan Mirbolouk, Fereidoun Azizi, Farzad Hadaegh, Farhad Hosseinpanah; Tromso: Marit Dahl Solbu, Bjørn Odvar Eriksen, Trond Geir Jenssen, Anne Elise Eggen; UK Biobank: Christoph Nowak, Johan Ärnlöv; ULSAM: Lars Lannfelt, Anders Larsson, Johan Ärnlöv; ZODIAC: Henk J.G. Bilo, Gijs W.D. Landman, Kornelis J.J. van Hateren, Nanne Kleefstra
CKD-PC Steering Committee: Josef Coresh (Chair), Shoshana H. Ballew, Alex R. Chang, Ron T. Gansevoort, Morgan E. Grams, Orlando M. Gutierrez, Tsuneo Konta, Anna Köttgen, Andrew S. Levey, Kunihiro Matsushita, Kevan Polkinghorne, Elke Schäffner, Mark Woodward, Luxia Zhang
CKD-PC Data Coordinating Center: Shoshana H. Ballew (Assistant Project Director), Jingsha Chen (Programmer), Josef Coresh (Principal Investigator), Morgan E. Grams (Director of Nephrology Initiatives), Kunihiro Matsushita (Director), Yingying Sang (Lead Programmer), Aditya Surapeneni (Programmer), Mark Woodward (Senior Statistician).
Appendix. Supplementary materials
References
- [1].
Evolving importance of kidney disease: from subspecialty to global health burden.
Lancet. 2013; 382: 158-169
- [2].
Chronic kidney disease and cardiovascular risk: epidemiology, mechanisms, and prevention.
Lancet. 2013; 382: 339-352
- [3].
Estimated glomerular filtration rate and albuminuria for prediction of cardiovascular outcomes: a collaborative meta-analysis of individual participant data.
Lancet Diabetes Endocrinol. 2015; 3: 514-525
- [4].
Association of estimated glomerular filtration rate and albuminuria with all-cause and cardiovascular mortality in general population cohorts: a collaborative meta-analysis.
Lancet. 2010; 375: 2073-2081
- [5].
2016 European Guidelines on cardiovascular disease prevention in clinical practice: the Sixth Joint Task Force of the European Society of Cardiology and Other Societies on Cardiovascular Disease Prevention in Clinical Practice (constituted by representatives of 10 societies and by invited experts)Developed with the special contribution of the European Association for Cardiovascular Prevention & Rehabilitation (EACPR).
Eur Heart J. 2016; 37: 2315-2381
- [6].
Associations of kidney disease measures with mortality and end-stage renal disease in individuals with and without diabetes: a meta-analysis.
Lancet. 2012; 380: 1662-1673
- [7].
Novel “predictor patch” method for adding predictors using estimates from outside datasets- a proof-of-concept study adding kidney measures to cardiovascular mortality prediction.
Circ J. 2019; 83: 1876-1882
- [8].
Cohort profile: the chronic kidney disease prognosis consortium.
Int J Epidemiol. 2013; 42: 1660-1668
- [9].
Kidney disease: improving global outcomes (KDIGO) CKD Work Group. KDIGO 2012 clinical practice guideline for the evaluation and management of chronic kidney disease.
Kidney Inter, Suppl. 2013; 3: 1-150
- [10].
A new equation to estimate glomerular filtration rate.
Ann Intern Med. 2009; 150: 604-612
- [11].
2013 ACC/AHA guideline on the assessment of cardiovascular risk: a report of the American college of cardiology/American heart association task force on practice guidelines.
Circulation. 2014; 129: S49-S73
- [12].
Estimation of ten-year risk of fatal cardiovascular disease in Europe: the SCORE project.
Eur. Heart J. 2003; 24: 987-1003
- [13].
Estimated glomerular filtration rate and albuminuria for prediction of cardiovascular outcomes: a collaborative meta-analysis of individual participant data.
Lancet Diabetes Endocrinol. 2015; 3: 514-525
- [14].
Validation of the Framingham coronary heart disease prediction scores: results of a multiple ethnic groups investigation.
JAMA. 2001; 286: 180-187
- [15].
Epidemiology: study design and data analysis.
2nd ed. Chapman & Hall/CRC,
Boca Raton, FL2005 - [16].
Overall C as a measure of discrimination in survival analysis: model specific population value and confidence interval estimation.
Stat Med. 2004; 23: 2109-2123
- [17].
Extensions of net reclassification improvement calculations to measure usefulness of new biomarkers.
Stat Med. 2011; 30: 11-21
- [18].
C-reactive protein, fibrinogen, and cardiovascular disease prediction.
N Engl J Med. 2012; 367: 1310-1320
- [19].
Longitudinal changes of cardiac structure and function in CKD (CASCADE study).
J Am Soc Nephrol. 2014; 25: 1599-1608
- [20].
World health organization cardiovascular disease risk charts: revised models to estimate risk in 21 global regions.
Lancet Glob Health. 2019; 7: e1332-e1e45
- [21].
Derivation and validation of QRISK, a new cardiovascular disease risk score for the United Kingdom: prospective open cohort study.
BMJ. 2007; 335: 136
- [22].
Prediction of 10-year vascular risk in patients with diabetes: the AD-ON risk score.
Diabetes Obes Metab. 2016; 18: 289-294
- [23].
A novel risk score to predict cardiovascular disease risk in national populations (Globorisk): a pooled analysis of prospective cohorts and health examination surveys.
Lancet Diabetes Endocrinol. 2015; 3: 339-355
Article Info
Publication History
Published: October 14, 2020
Accepted:
September 4,
2020
Received in revised form:
September 1,
2020
Received:
July 13,
2020
Footnotes
For the Chronic Kidney Disease Prognosis Consortium
Identification
Copyright
© 2020 The Authors. Published by Elsevier Ltd.
User License
Creative Commons Attribution – NonCommercial – NoDerivs (CC BY-NC-ND 4.0) |

Permitted
For non-commercial purposes:
- Read, print & download
- Redistribute or republish the final article
- Text & data mine
- Translate the article (private use only, not for distribution)
- Reuse portions or extracts from the article in other works
Not Permitted
- Sell or re-use for commercial purposes
- Distribute translations or adaptations of the article
ScienceDirect


