
- EUR/USD spikes to 1.1094 resistance before the London close.
- Support is seen at the 1.1083 and 1.1060 price levels.
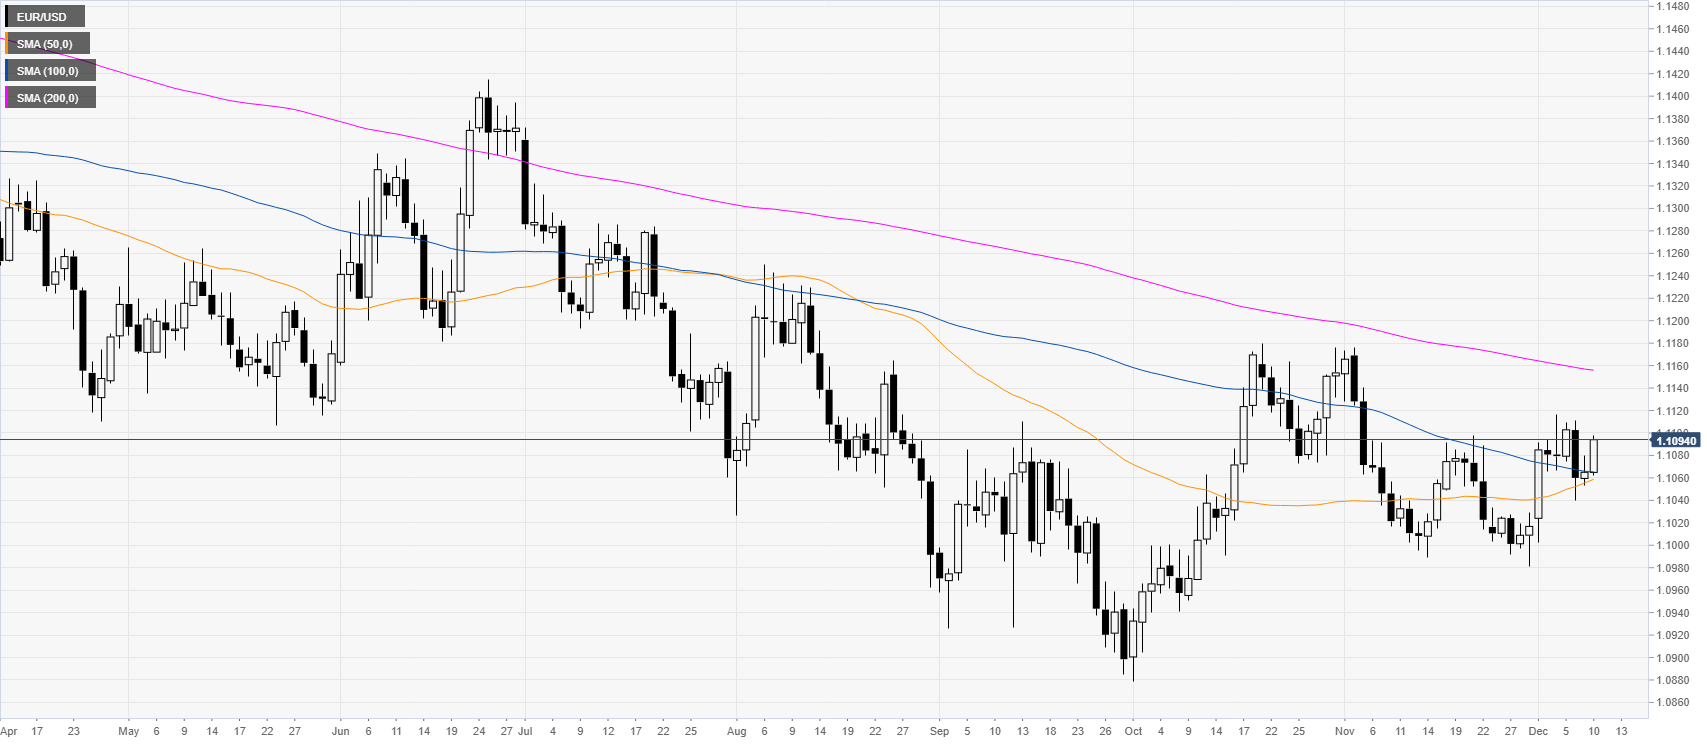
EUR/USD daily chart
The common currency, on the daily chart, is trading below the 200-day simple moving average (DMA). However, at the start of the month, the spot had a significant bullish reversal. The sellers would need a daily close below the 1.1000 figure to restore a clear bearish bias.
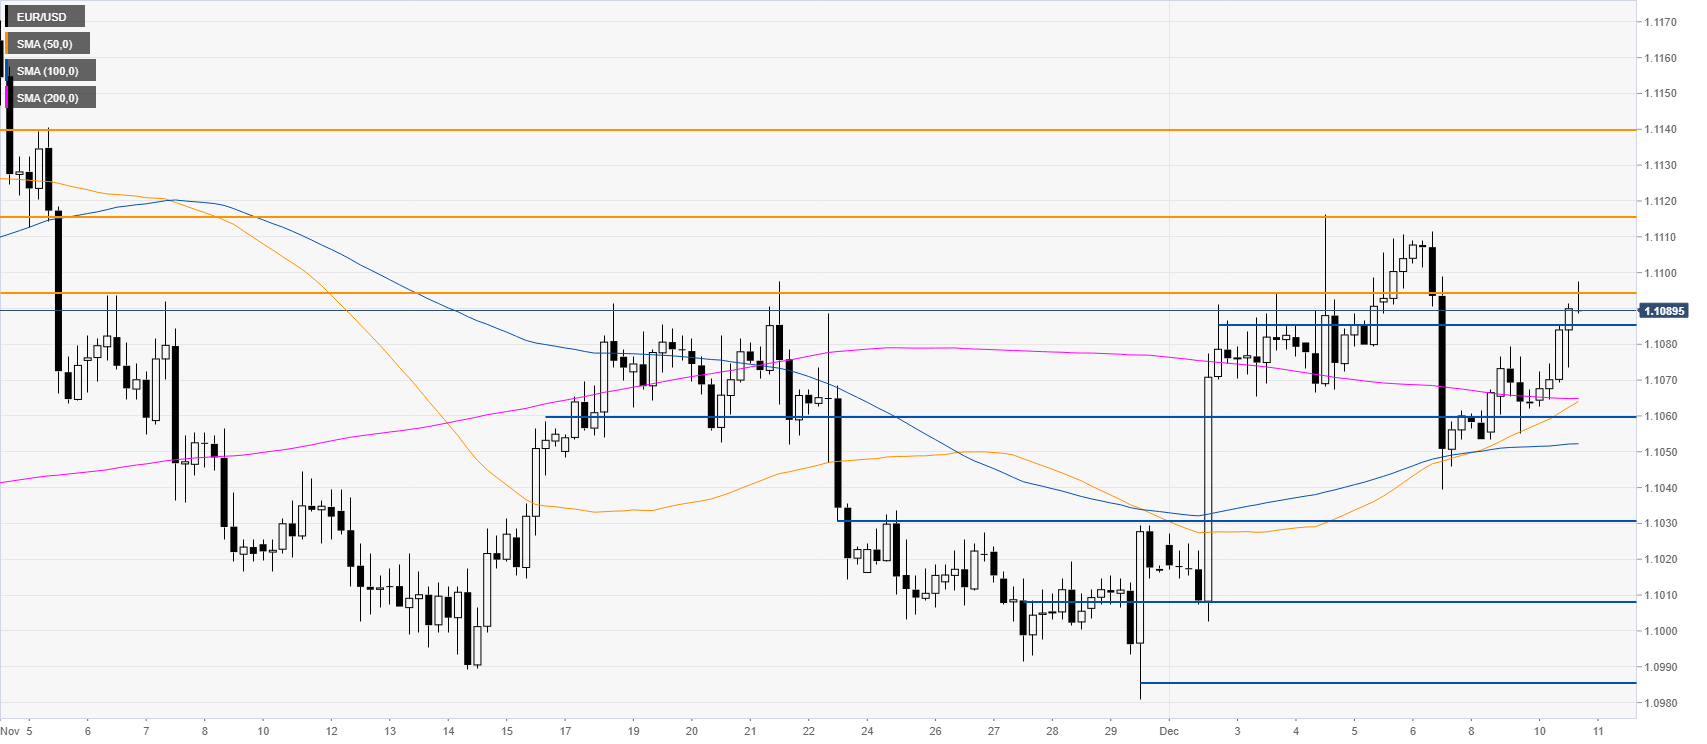
EUR/USD four-hour chart
EUR/USD is challenging the 1.1094 resistance while trading above the main SMAs on the four-hour chart. A daily close above this level would be seen as a bullish sign. However, the market could still be in correction below 1.1094. In the event bulls break above 1.1094 resistance, the market is likely to trade towards the 1.1117 level, according to the Technical Confluences Indicator.
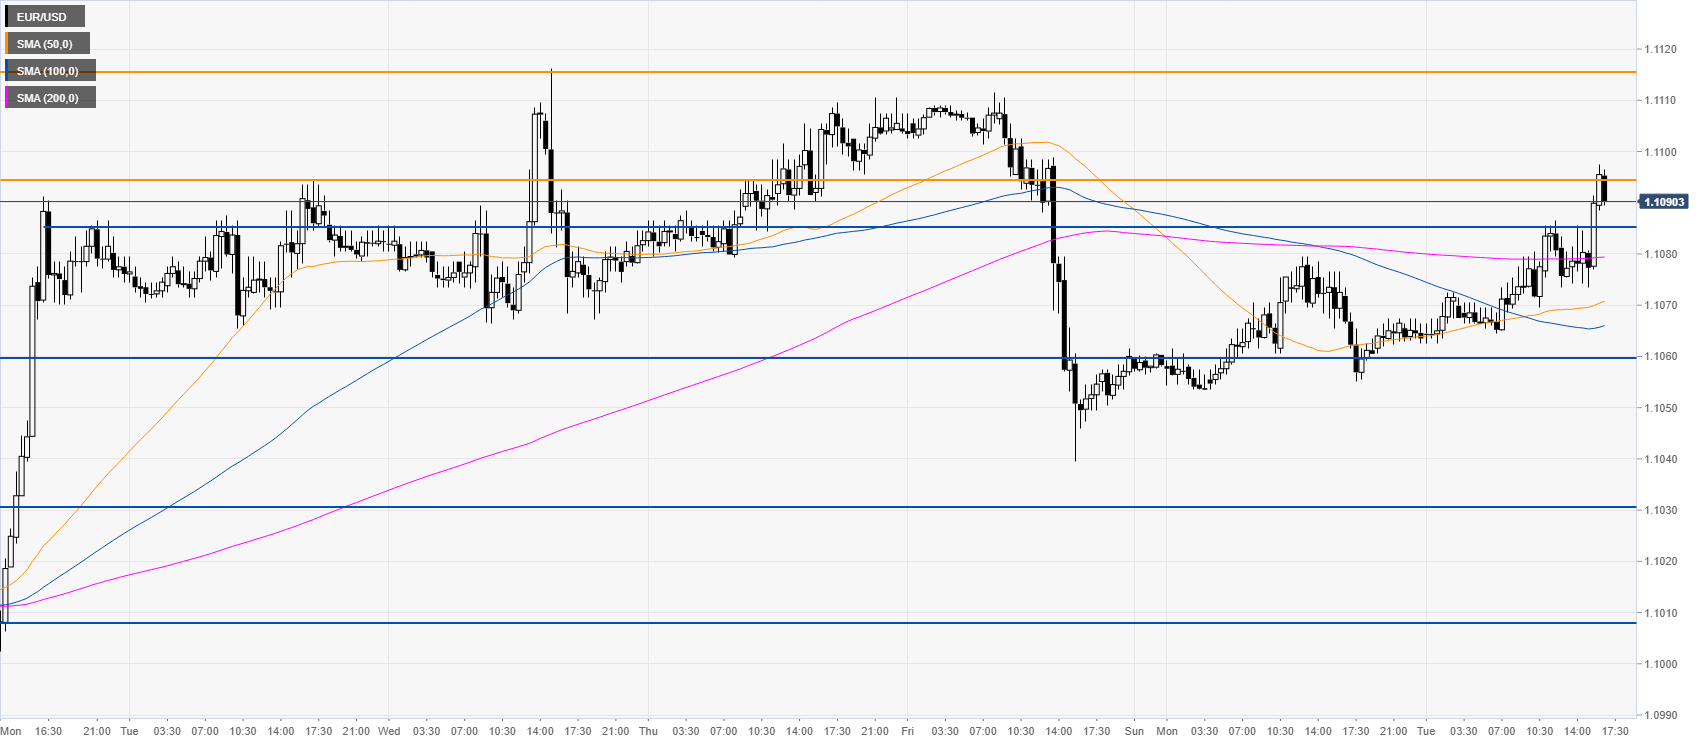
EUR/USD 30-minute chart
The euro is keeping the sidelined theme for the sixth consecutive day. Support is seen at 1.1083 and 1.1060 level. If bears break below the latter, the 1.1031, 1.1008 and 1.0985 levels can be on the cards, according to the Technical Confluences Indicator.
Additional key levels


