GLOBAL RESEARCH SYNDICATE
No Result
View All Result
  • Login
  • Latest News
  • Consumer Research
  • Survey Research
  • Marketing Research
  • Industry Research
  • Data Collection
  • More
    • Data Analysis
    • Market Insights
  • Latest News
  • Consumer Research
  • Survey Research
  • Marketing Research
  • Industry Research
  • Data Collection
  • More
    • Data Analysis
    • Market Insights
No Result
View All Result
globalresearchsyndicate
No Result
View All Result
Home Data Analysis

XLM prints a scary bearish pattern on its monthly chart

globalresearchsyndicate by globalresearchsyndicate
September 30, 2020
in Data Analysis
0
XLM/USD is looking to break out of the 0.0771 area
0
SHARES
5
VIEWS
Share on FacebookShare on Twitter

  • An Evening Star on a monthly chart bodes ill for Stellar (XLM). 
  • The price needs to regain $0.08 to improve the technical picture.

Stellar (XLM) is the 18th largest digital asset with a current market capitalization of $1.5 billion and an average daily trading volume of $115 million. The coin is most actively traded at Binance against USDT and BTC. The coin, created by Jed McCaleb, came to life in July 2014 as a primary competitor of Ripple.

In the recent interview with Coinmarketcap, Jed McCaleb explained the crucial rationale behind the project:

The whole original design of Stellar is that you can have fiat currencies and other kinds of forms of value run in parallel with each other and with crypto assets. This is super important to drive this stuff mainstream.

Stellar topped at $0.17 in May 2019 and hit the all-time low of $0.026 in March 2020 amid the significant sell-off on the cryptocurrency marker caused by COVID-19 panic. Since that time, the coin managed to recover to $0.12; however, the further price movements may be less impressive as the technical picture sends ominous signals. 

XLM/USD: The technical picture

At the time of writing, XLM/USD is changing hands at $0.072. In September, the coin has lost over a quarter fo its value, and the worst may not be over yet. On the monthly chart, XLM seems to have printed an evening Doji star, one of the most powerful candlestick patterns with bearish connotations. 

XLM/USD monthly chart

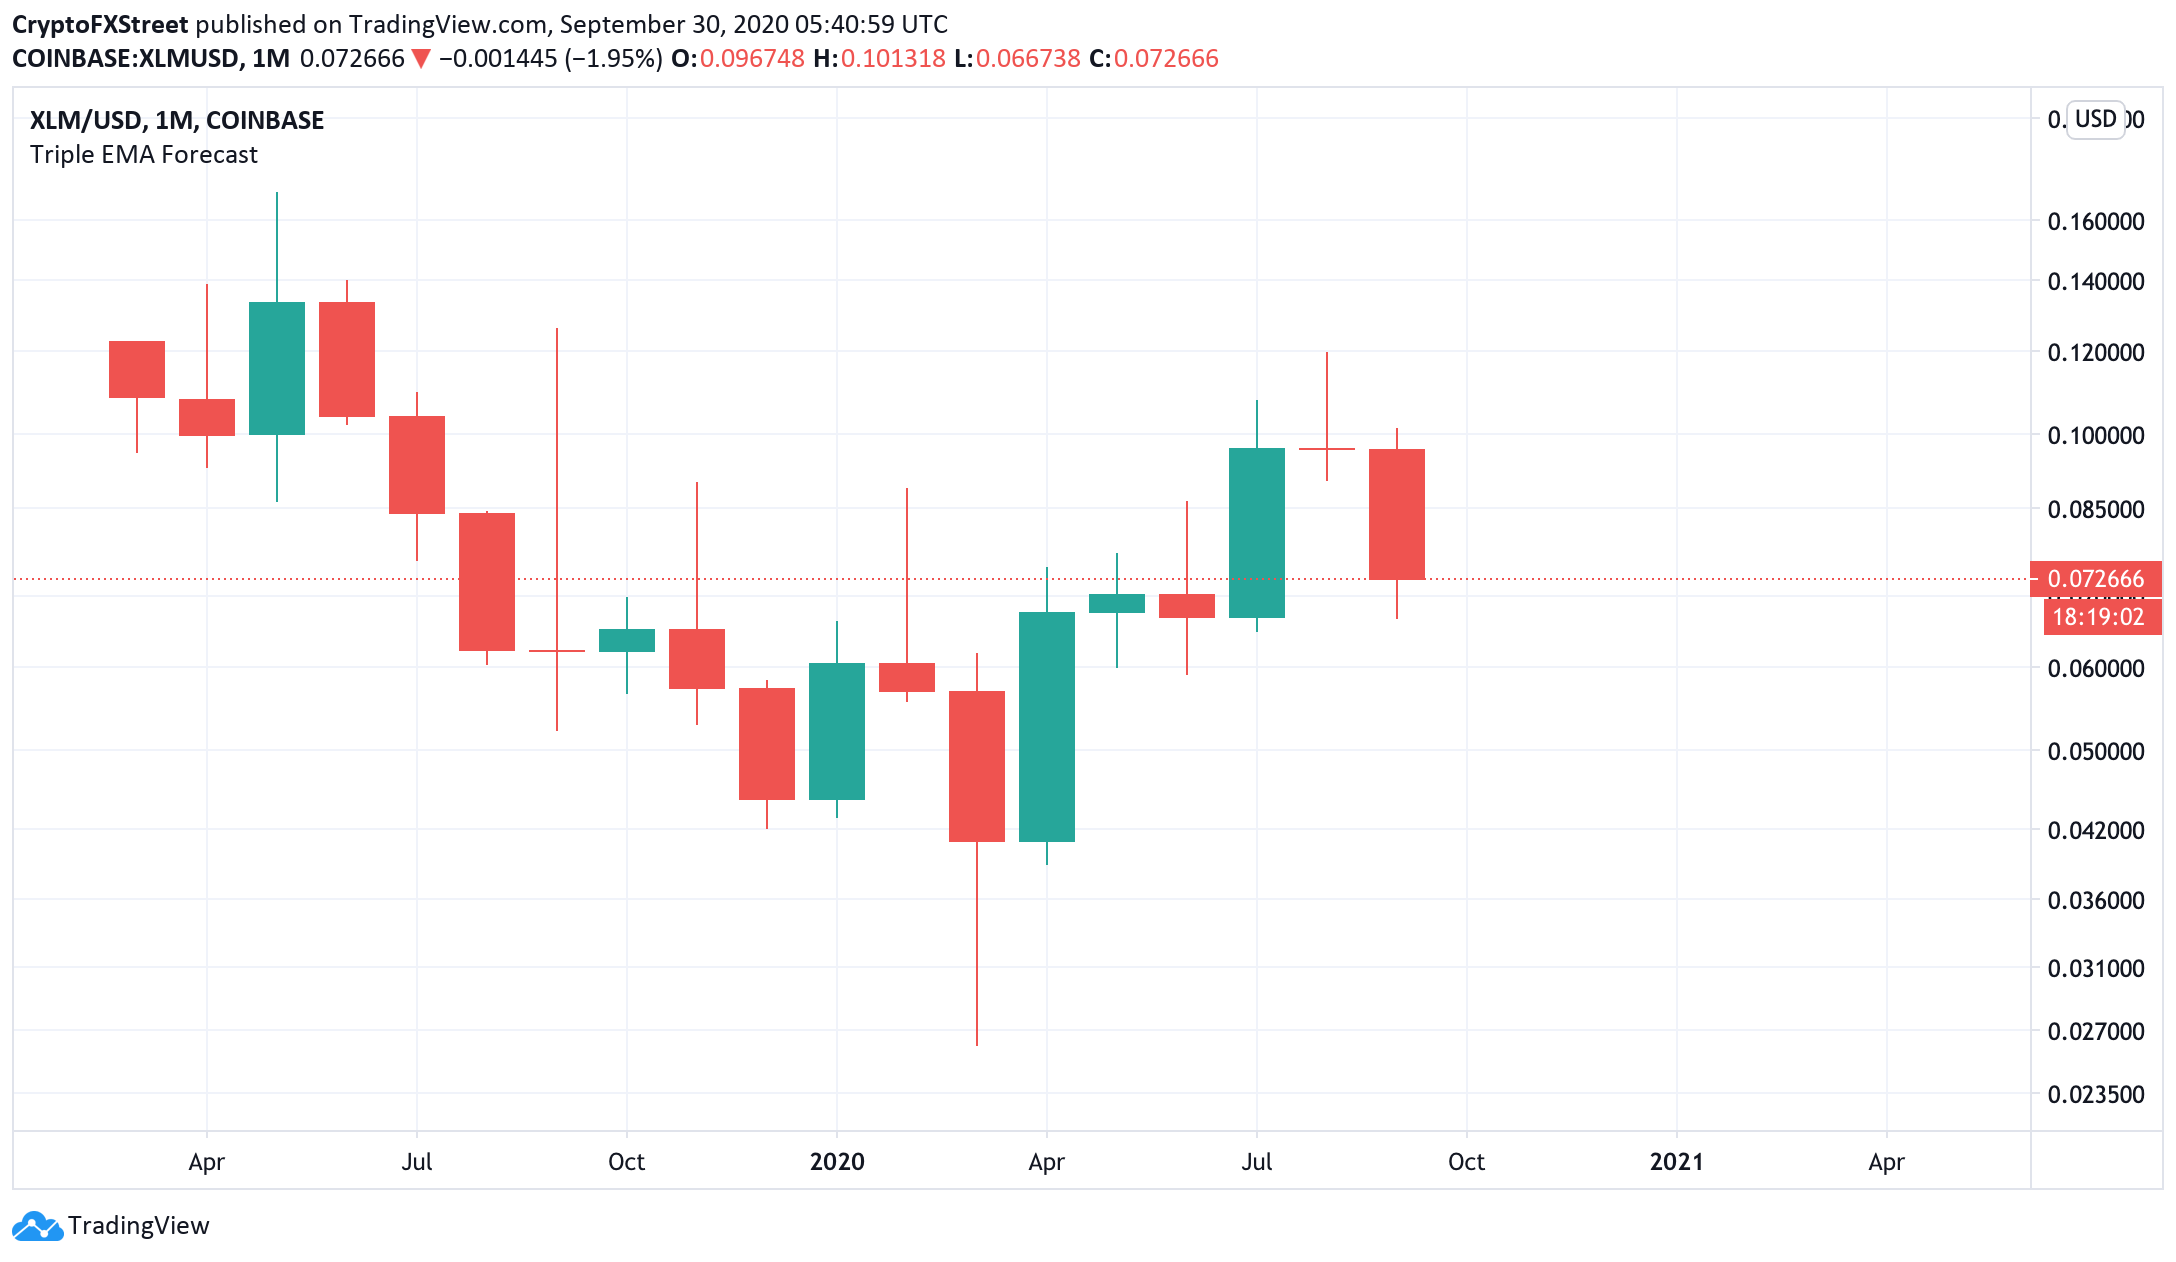
The evening star is a reversal pattern consisting of three candles.  A long green candle brings the price to a new high. It is followed by a candle with a long upper shadow and a small or no body, signaling that the buying potential is fading away. The formation is finished by a big red candle, which predicts that the decline will continue to even lower lows.

According to Thomas Bulkowski, an expert on chart patterns, an Evening Start has a 72% accuracy rate, which makes it a reliable technical indicator. Let’s zoom in to a weekly chart to see if the long-term bearish signal is confirmed here.

XLM/USD weekly chart

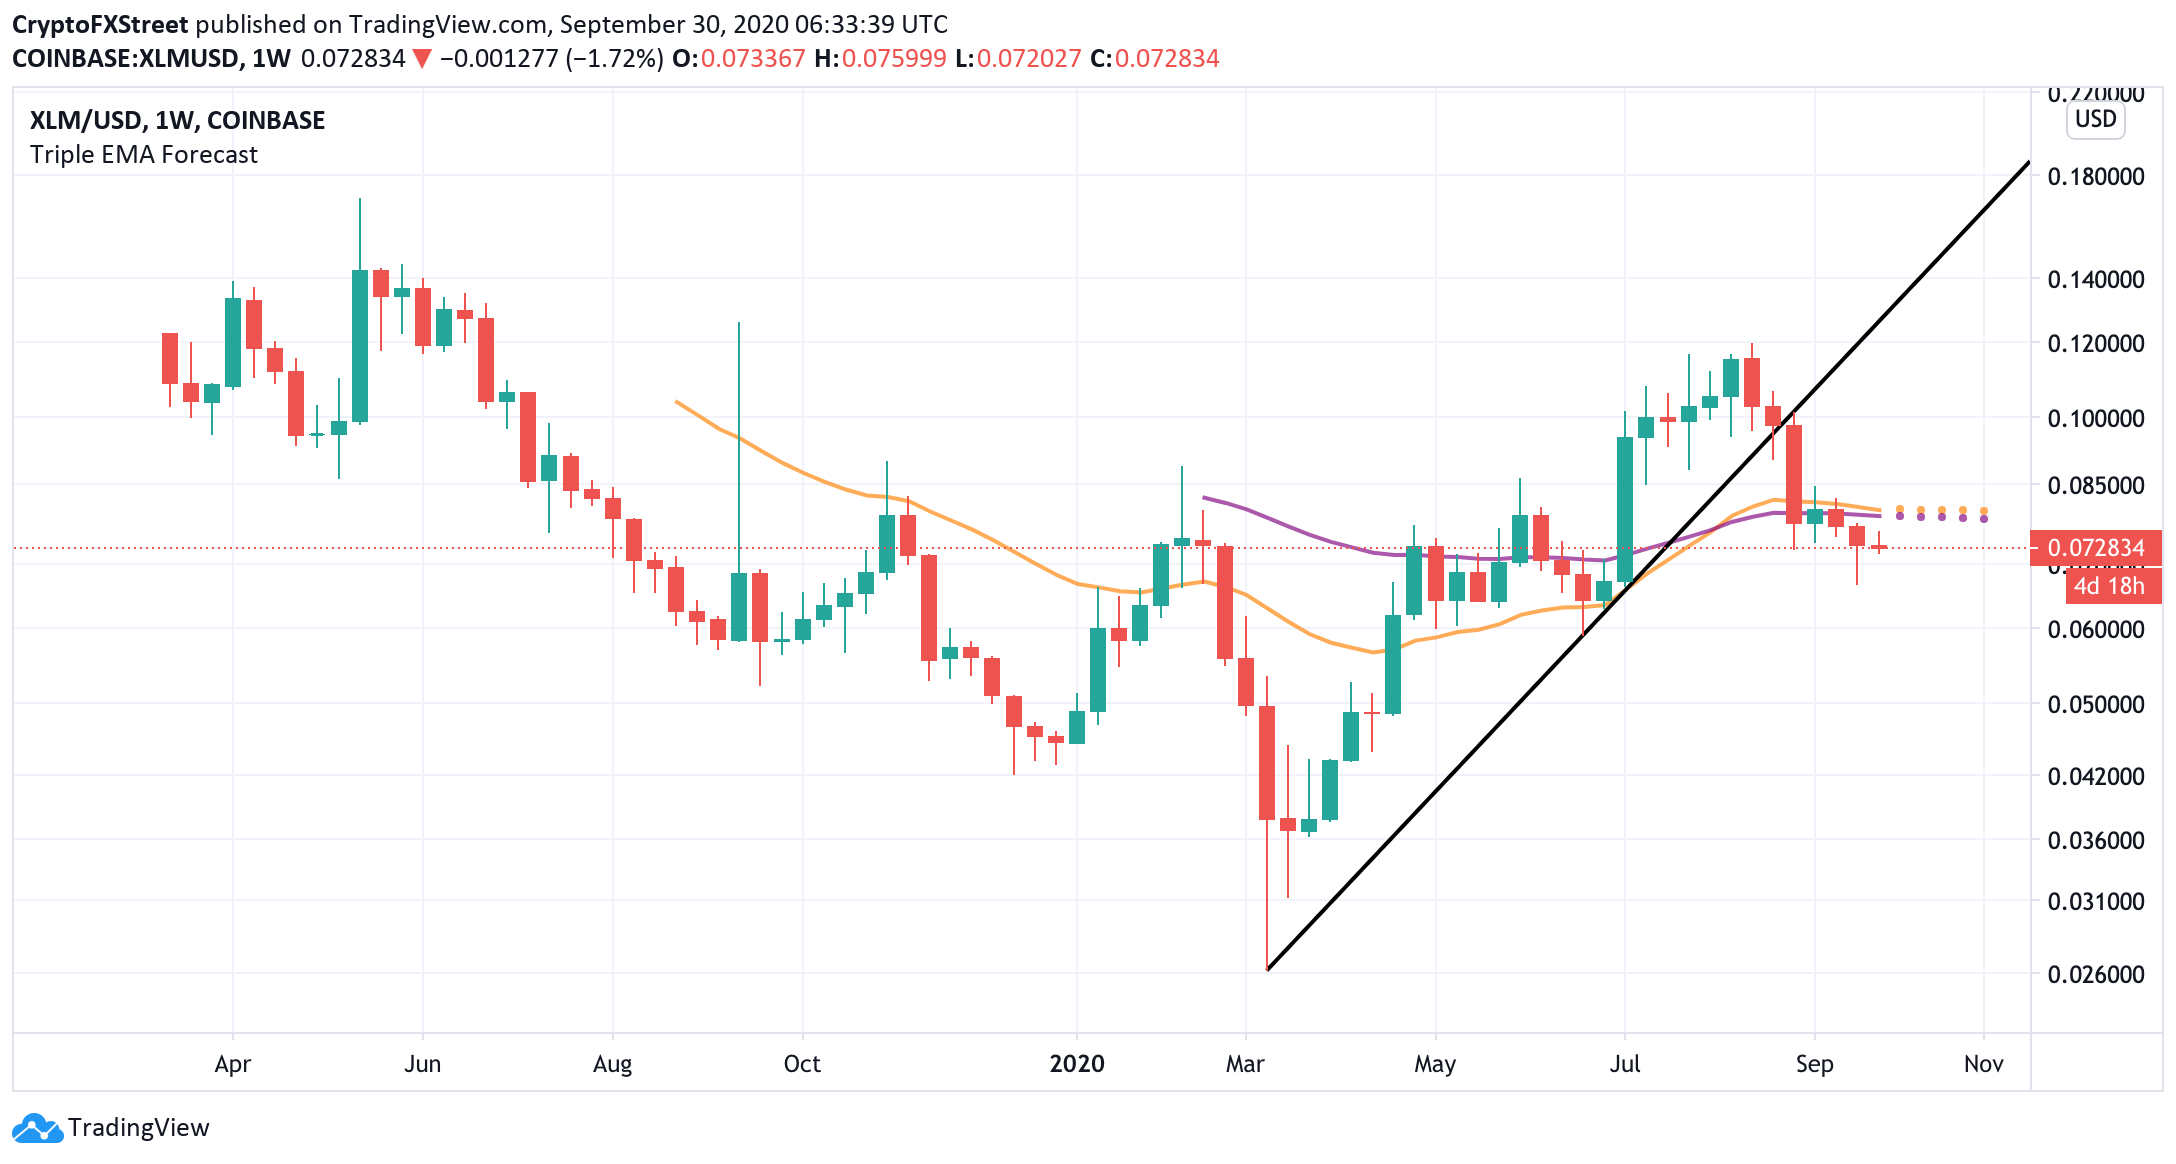
On a weekly chart, XLM/USD broke below the upside trendline from the March low and continued drifting lower until it hit $0.066. While the price managed to recover from the trough, the upside is still limited by a potent combination of the short-term and mid-term EMAs (exponential moving averages) on approach to $0.08. 

A sustainable move above this area is needed to mitigate the immediate bearish pressure and improve the technical picture. Otherwise, the sell-off may continue towards the recent low of $0.066 and to $0.05.

XLM/USD daily chart

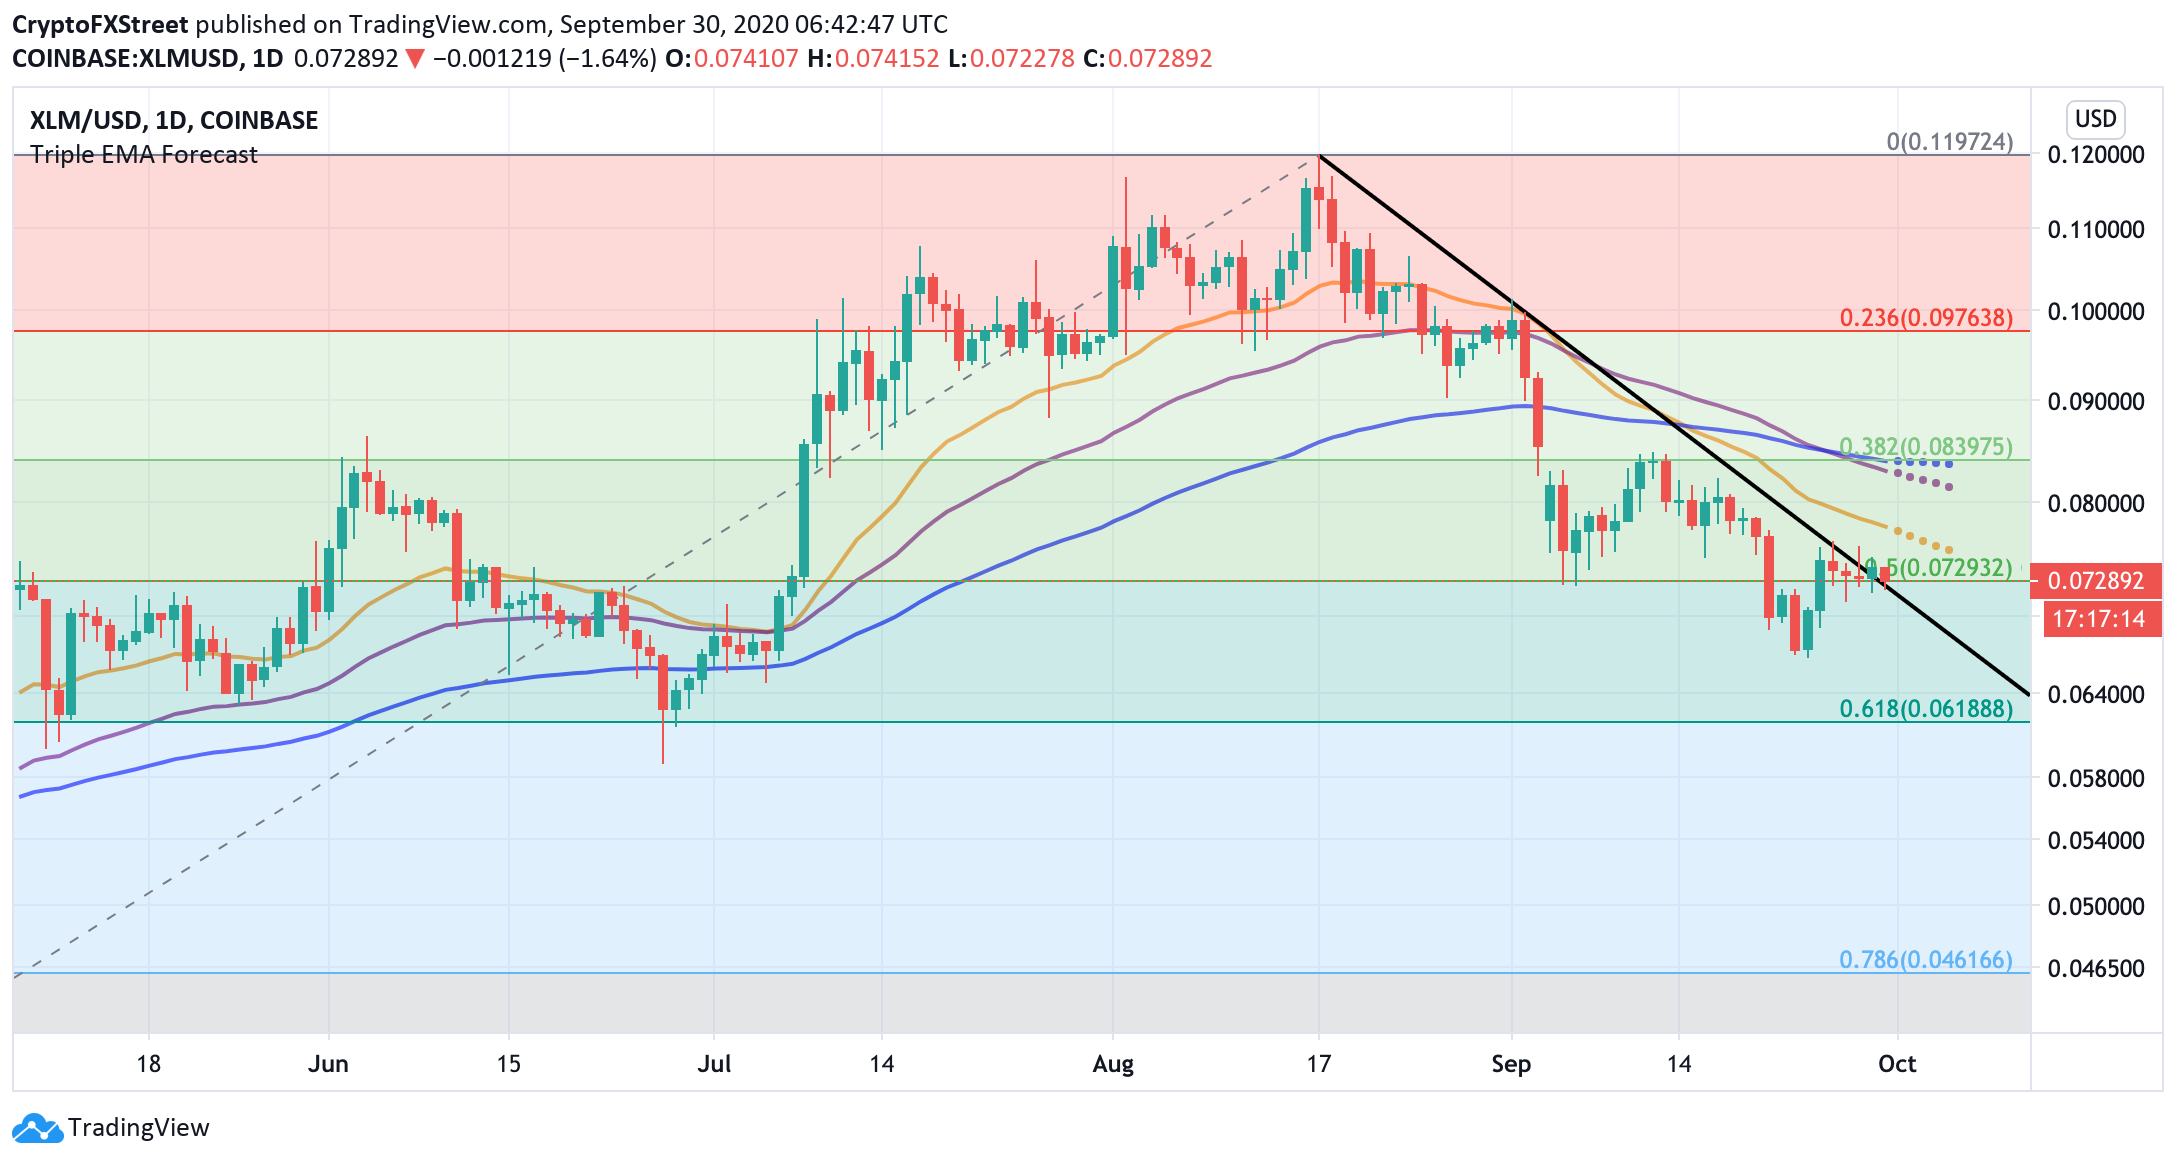
Meanwhile, on a daily chart, XLM/USD is hovering around 50% Fib from March low to the recent high. If this barrier is broken, the sell-off may be extended towards the 61.8% Fib at $0.06, and if this one fails to hold, the 78.6% Fib at $0.46 will come into play.

On the other hand, if XLM/USD settles above the downside trendline from the August 17 high, the bulls will get a chance to take the price to $0.08. However, resistance is reinforced by a combination of daily EMAs and 38.2% Fib, making it a hard nut to crack.

To conclude: The long-term bearish signals created by the Evening Doji Star on the monthly chart are confirmed by the signals on the shorter time frames. 50% Fib at $0.072 serves as an initial barrier that separates the coin from a downside spiral towards $0.06 and potentially $0.046.

On the other hand, a recovery above $0.08 will invalidate the immediate bearish scenario and allow for an extended recovery. 

Related Posts

How Machine Learning has impacted Consumer Behaviour and Analysis
Consumer Research

How Machine Learning has impacted Consumer Behaviour and Analysis

January 4, 2024
Market Research The Ultimate Weapon for Business Success
Consumer Research

Market Research: The Ultimate Weapon for Business Success

June 22, 2023
Unveiling the Hidden Power of Market Research A Game Changer
Consumer Research

Unveiling the Hidden Power of Market Research: A Game Changer

June 2, 2023
7 Secrets of Market Research Gurus That Will Blow Your Mind
Consumer Research

7 Secrets of Market Research Gurus That Will Blow Your Mind

May 8, 2023
The Shocking Truth About Market Research Revealed!
Consumer Research

The Shocking Truth About Market Research: Revealed!

April 25, 2023
market research, primary research, secondary research, market research trends, market research news,
Consumer Research

Quantitative vs. Qualitative Research. How to choose the Right Research Method for Your Business Needs

March 14, 2023
Next Post
Network Traffic Analyzer Market: Research Report Covers Updated Data on Key Players Considering Impact of COVID 19

Quick Service Restaurant (QSR) IT Market: Research Report Covers Updated Data on Key Players Considering Impact of COVID 19

Categories

  • Consumer Research
  • Data Analysis
  • Data Collection
  • Industry Research
  • Latest News
  • Market Insights
  • Marketing Research
  • Survey Research
  • Uncategorized

Recent Posts

  • Ipsos Revolutionizes the Global Market Research Landscape
  • How Machine Learning has impacted Consumer Behaviour and Analysis
  • Market Research: The Ultimate Weapon for Business Success
  • Privacy Policy
  • Terms of Use
  • Antispam
  • DMCA

Copyright © 2024 Globalresearchsyndicate.com

Welcome Back!

Login to your account below

Forgotten Password?

Retrieve your password

Please enter your username or email address to reset your password.

Log In
This website uses cookies to improve your experience. We'll assume you're ok with this, but you can opt-out if you wish. Cookie settingsACCEPT
Privacy & Cookies Policy

Privacy Overview

This website uses cookies to improve your experience while you navigate through the website. Out of these cookies, the cookies that are categorized as necessary are stored on your browser as they are essential for the working of basic functionalities of the website. We also use third-party cookies that help us analyze and understand how you use this website. These cookies will be stored in your browser only with your consent. You also have the option to opt-out of these cookies. But opting out of some of these cookies may have an effect on your browsing experience.
Necessary
Always Enabled
Necessary cookies are absolutely essential for the website to function properly. This category only includes cookies that ensures basic functionalities and security features of the website. These cookies do not store any personal information.
Non-necessary
Any cookies that may not be particularly necessary for the website to function and is used specifically to collect user personal data via analytics, ads, other embedded contents are termed as non-necessary cookies. It is mandatory to procure user consent prior to running these cookies on your website.
SAVE & ACCEPT
No Result
View All Result
  • Latest News
  • Consumer Research
  • Survey Research
  • Marketing Research
  • Industry Research
  • Data Collection
  • More
    • Data Analysis
    • Market Insights

Copyright © 2024 Globalresearchsyndicate.com