
| ⠀Bitcoin price: | $7,450 |
|---|---|
| ⠀Key BTC resistance levels: | $7,570, $7,698, $7,915, $8,000, $8,242 |
| ⠀Key BTC support levels: | $7,000, $6,963, $6,790, $6,655, $6,500 |
*Price at the time of writing
Bitcoin saw a strong surge today as it increased by almost 8% in the space of one hour! BTC managed to surge as high as $7,775 before the coin started to fall back slightly to reach the current level at around $7,500.
Previous to this price increase, Bitcoin was trending lower as the cryptocurrency started the month by dropping as low as $7,050.
Despite the recent price increase, we need to remember that Bitcoin is still down by a total of 30% over the past 3 months and is still a long way from turning into any form of a bullish trend.
How to buy Bitcoin (BTC) on Binance?
Bitcoin price analysis
What has been going on?
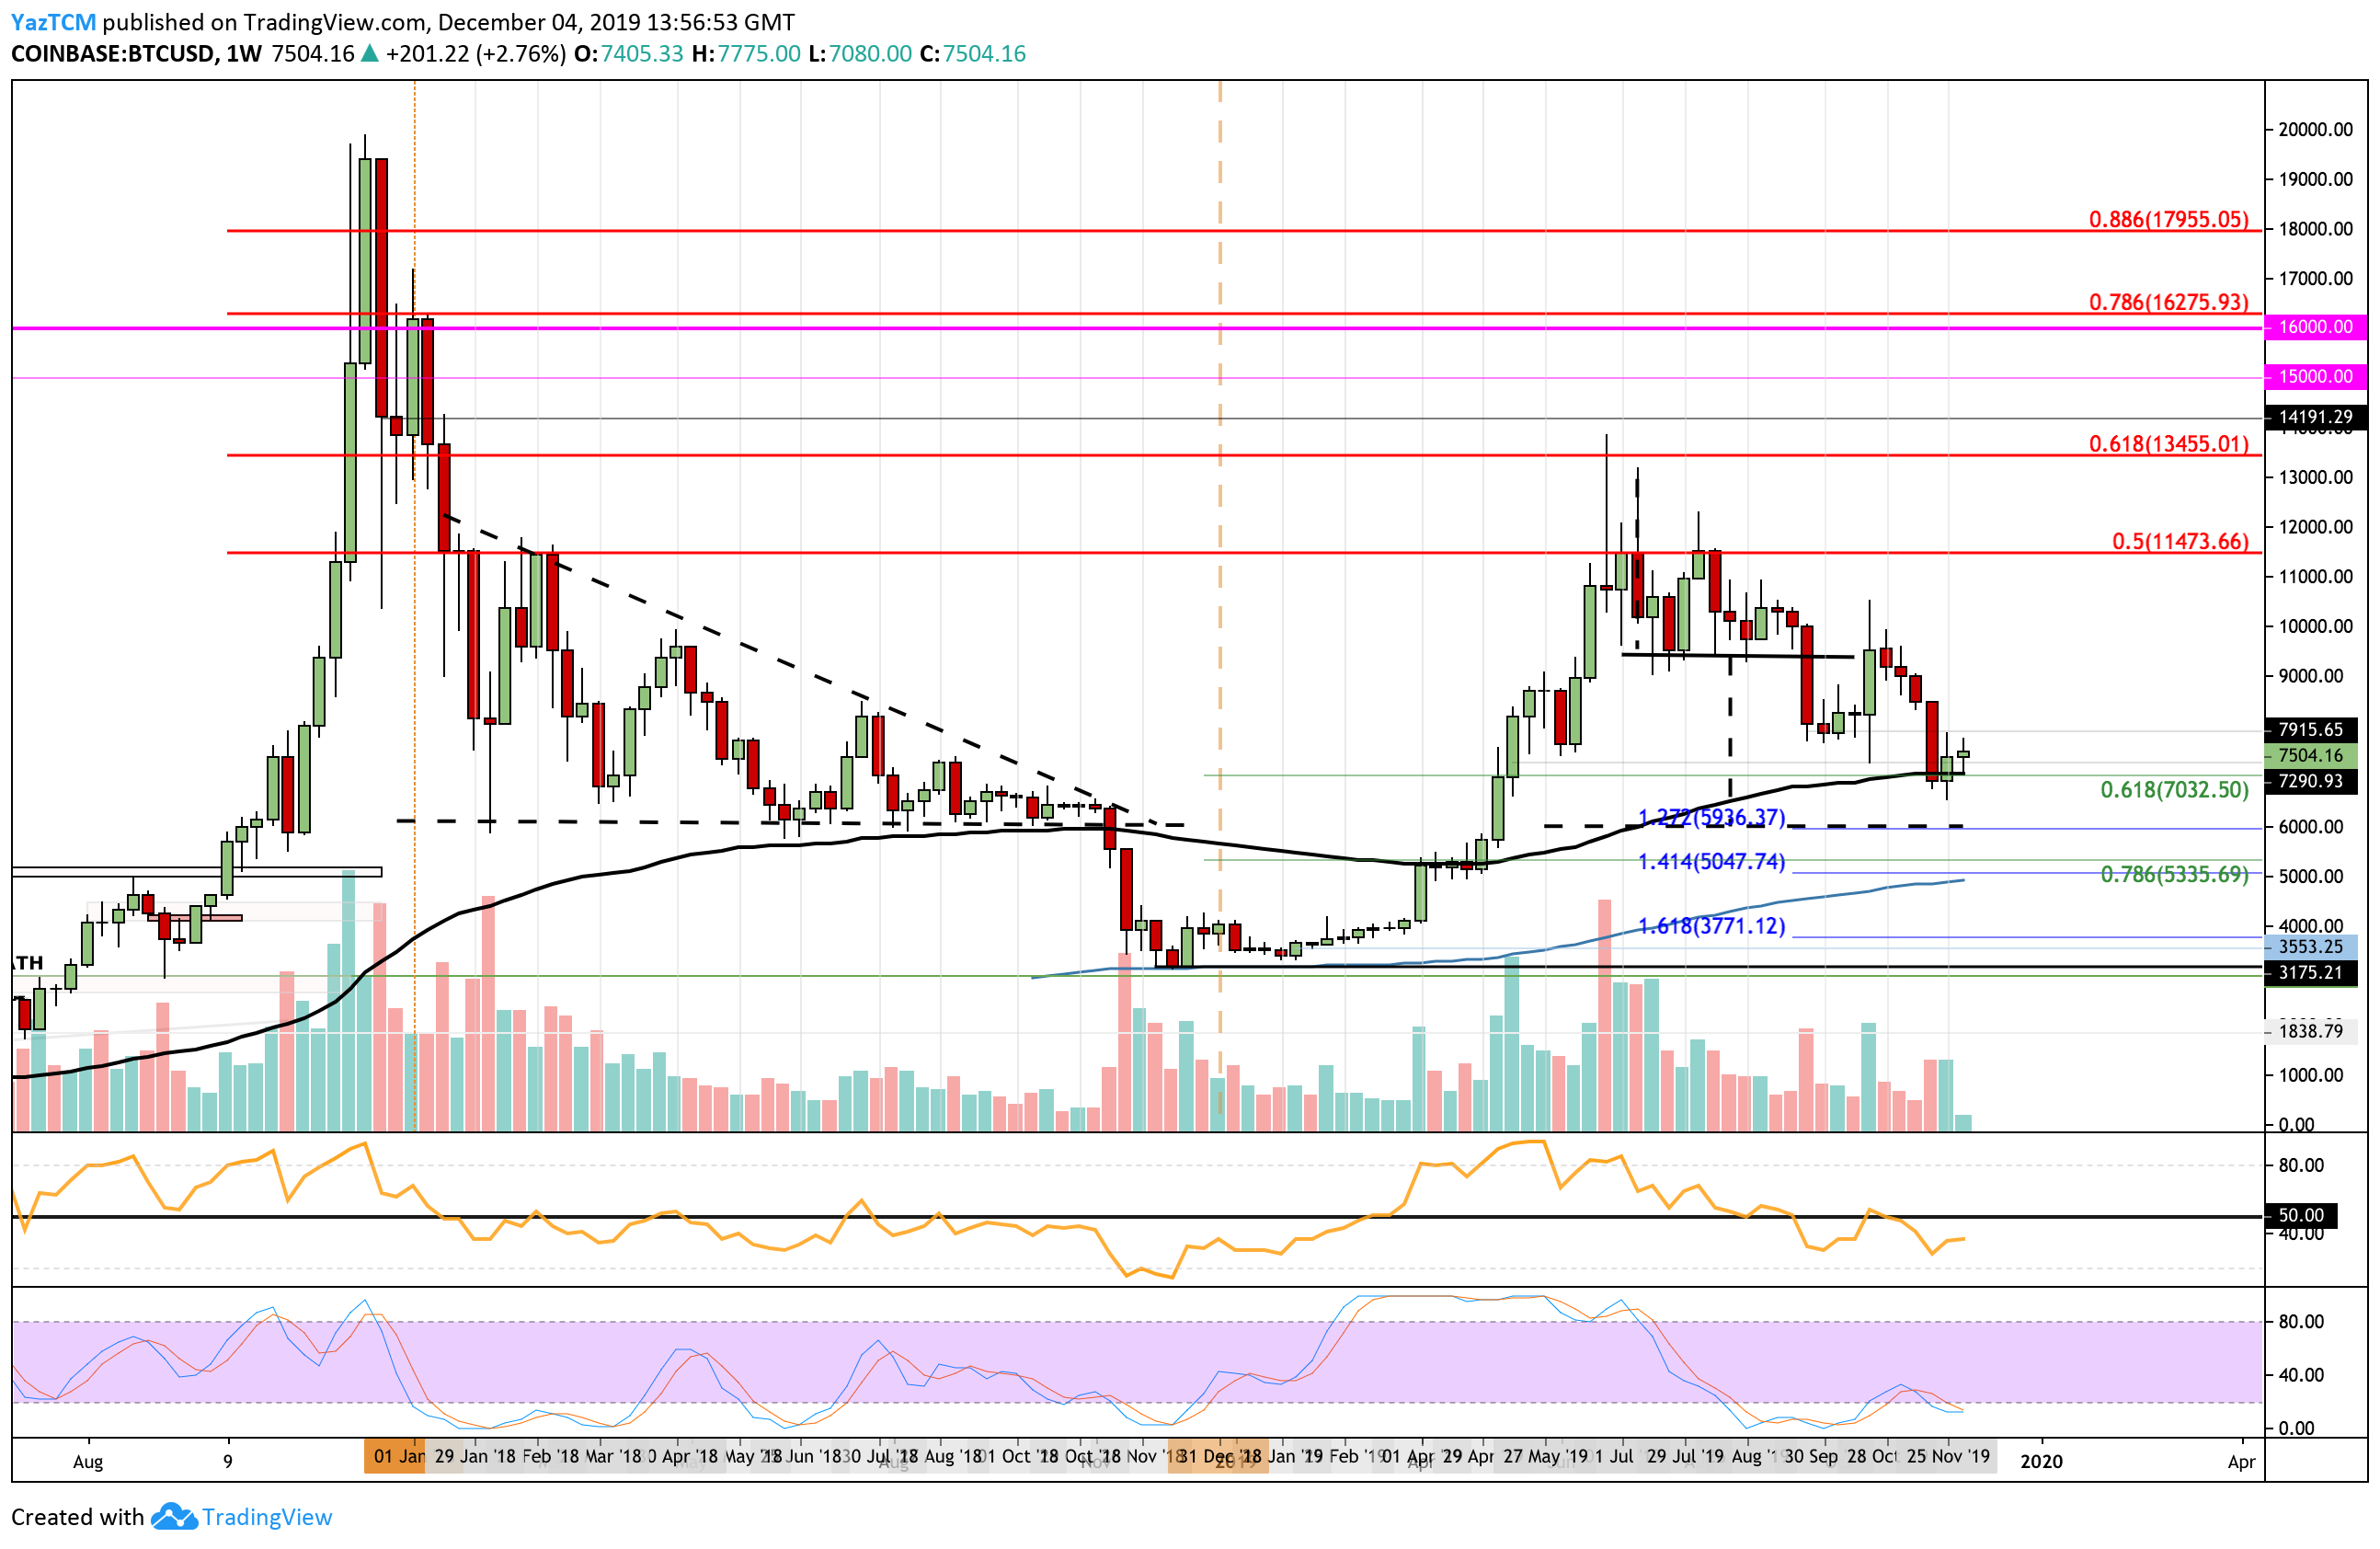
Taking a look at the long term weekly charts, we can see that Bitcoin started the year off on a strong bullish footing as the market surged by a total of 310% from the February low to the June high. We can see that BTC ran into resistance at a long-term bearish .5 Fibonacci Retracement level priced at $11,473 and was unable to close any weekly candle above this strong level of resistance.
After reaching the 2019 high, Bitcoin rolled over and has returned to the .618 Fib retracement at $7,032. This is the “Golden Retracement” and could potentially provide enough strong support to prevent the market from heading further lower.
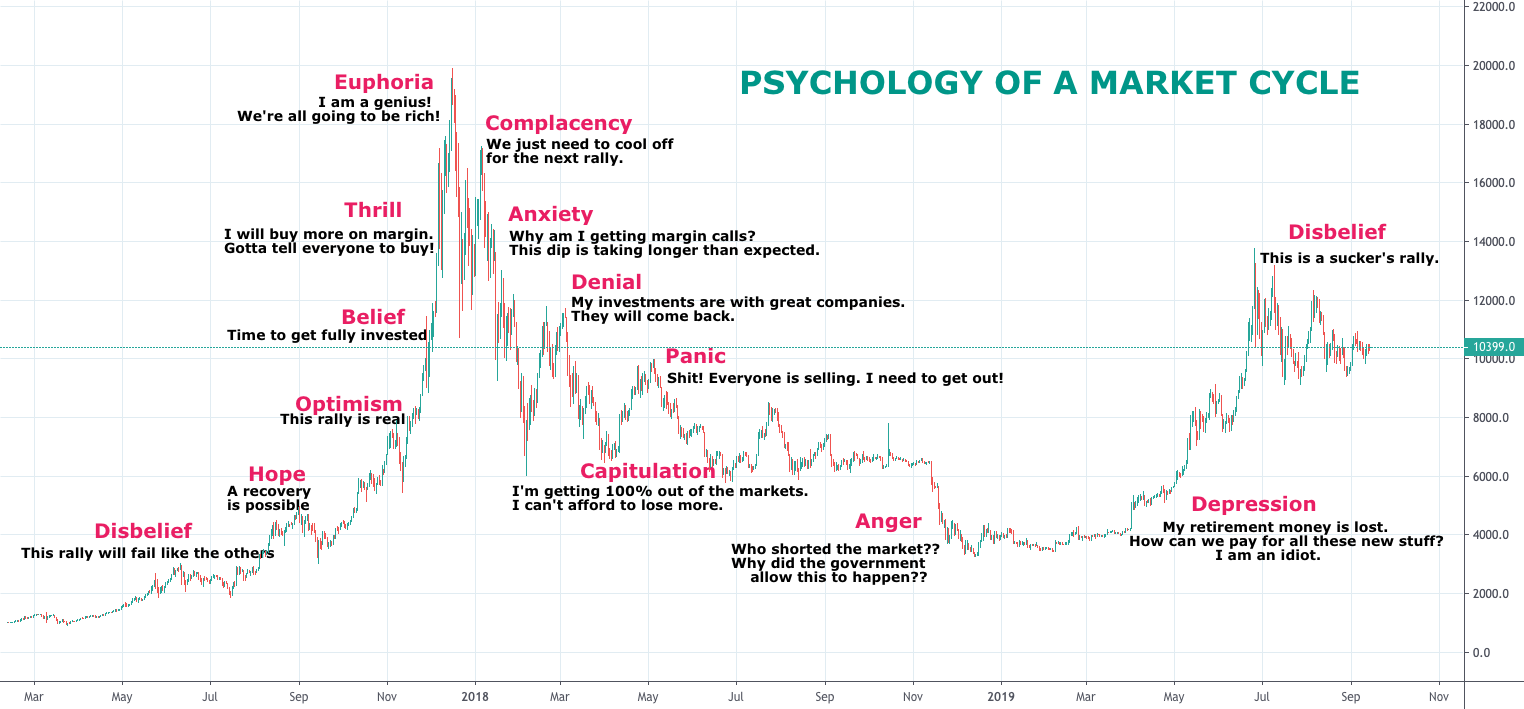
We have all seen this chart depicting all of the emotions that come into play during a market cycle. I would not quite say we are at the disbelief stage, but the bounce at the .618 Fib Retracement does give some strong hope moving forward.
Bitcoin price short-term prediction: Bearish/Neutral
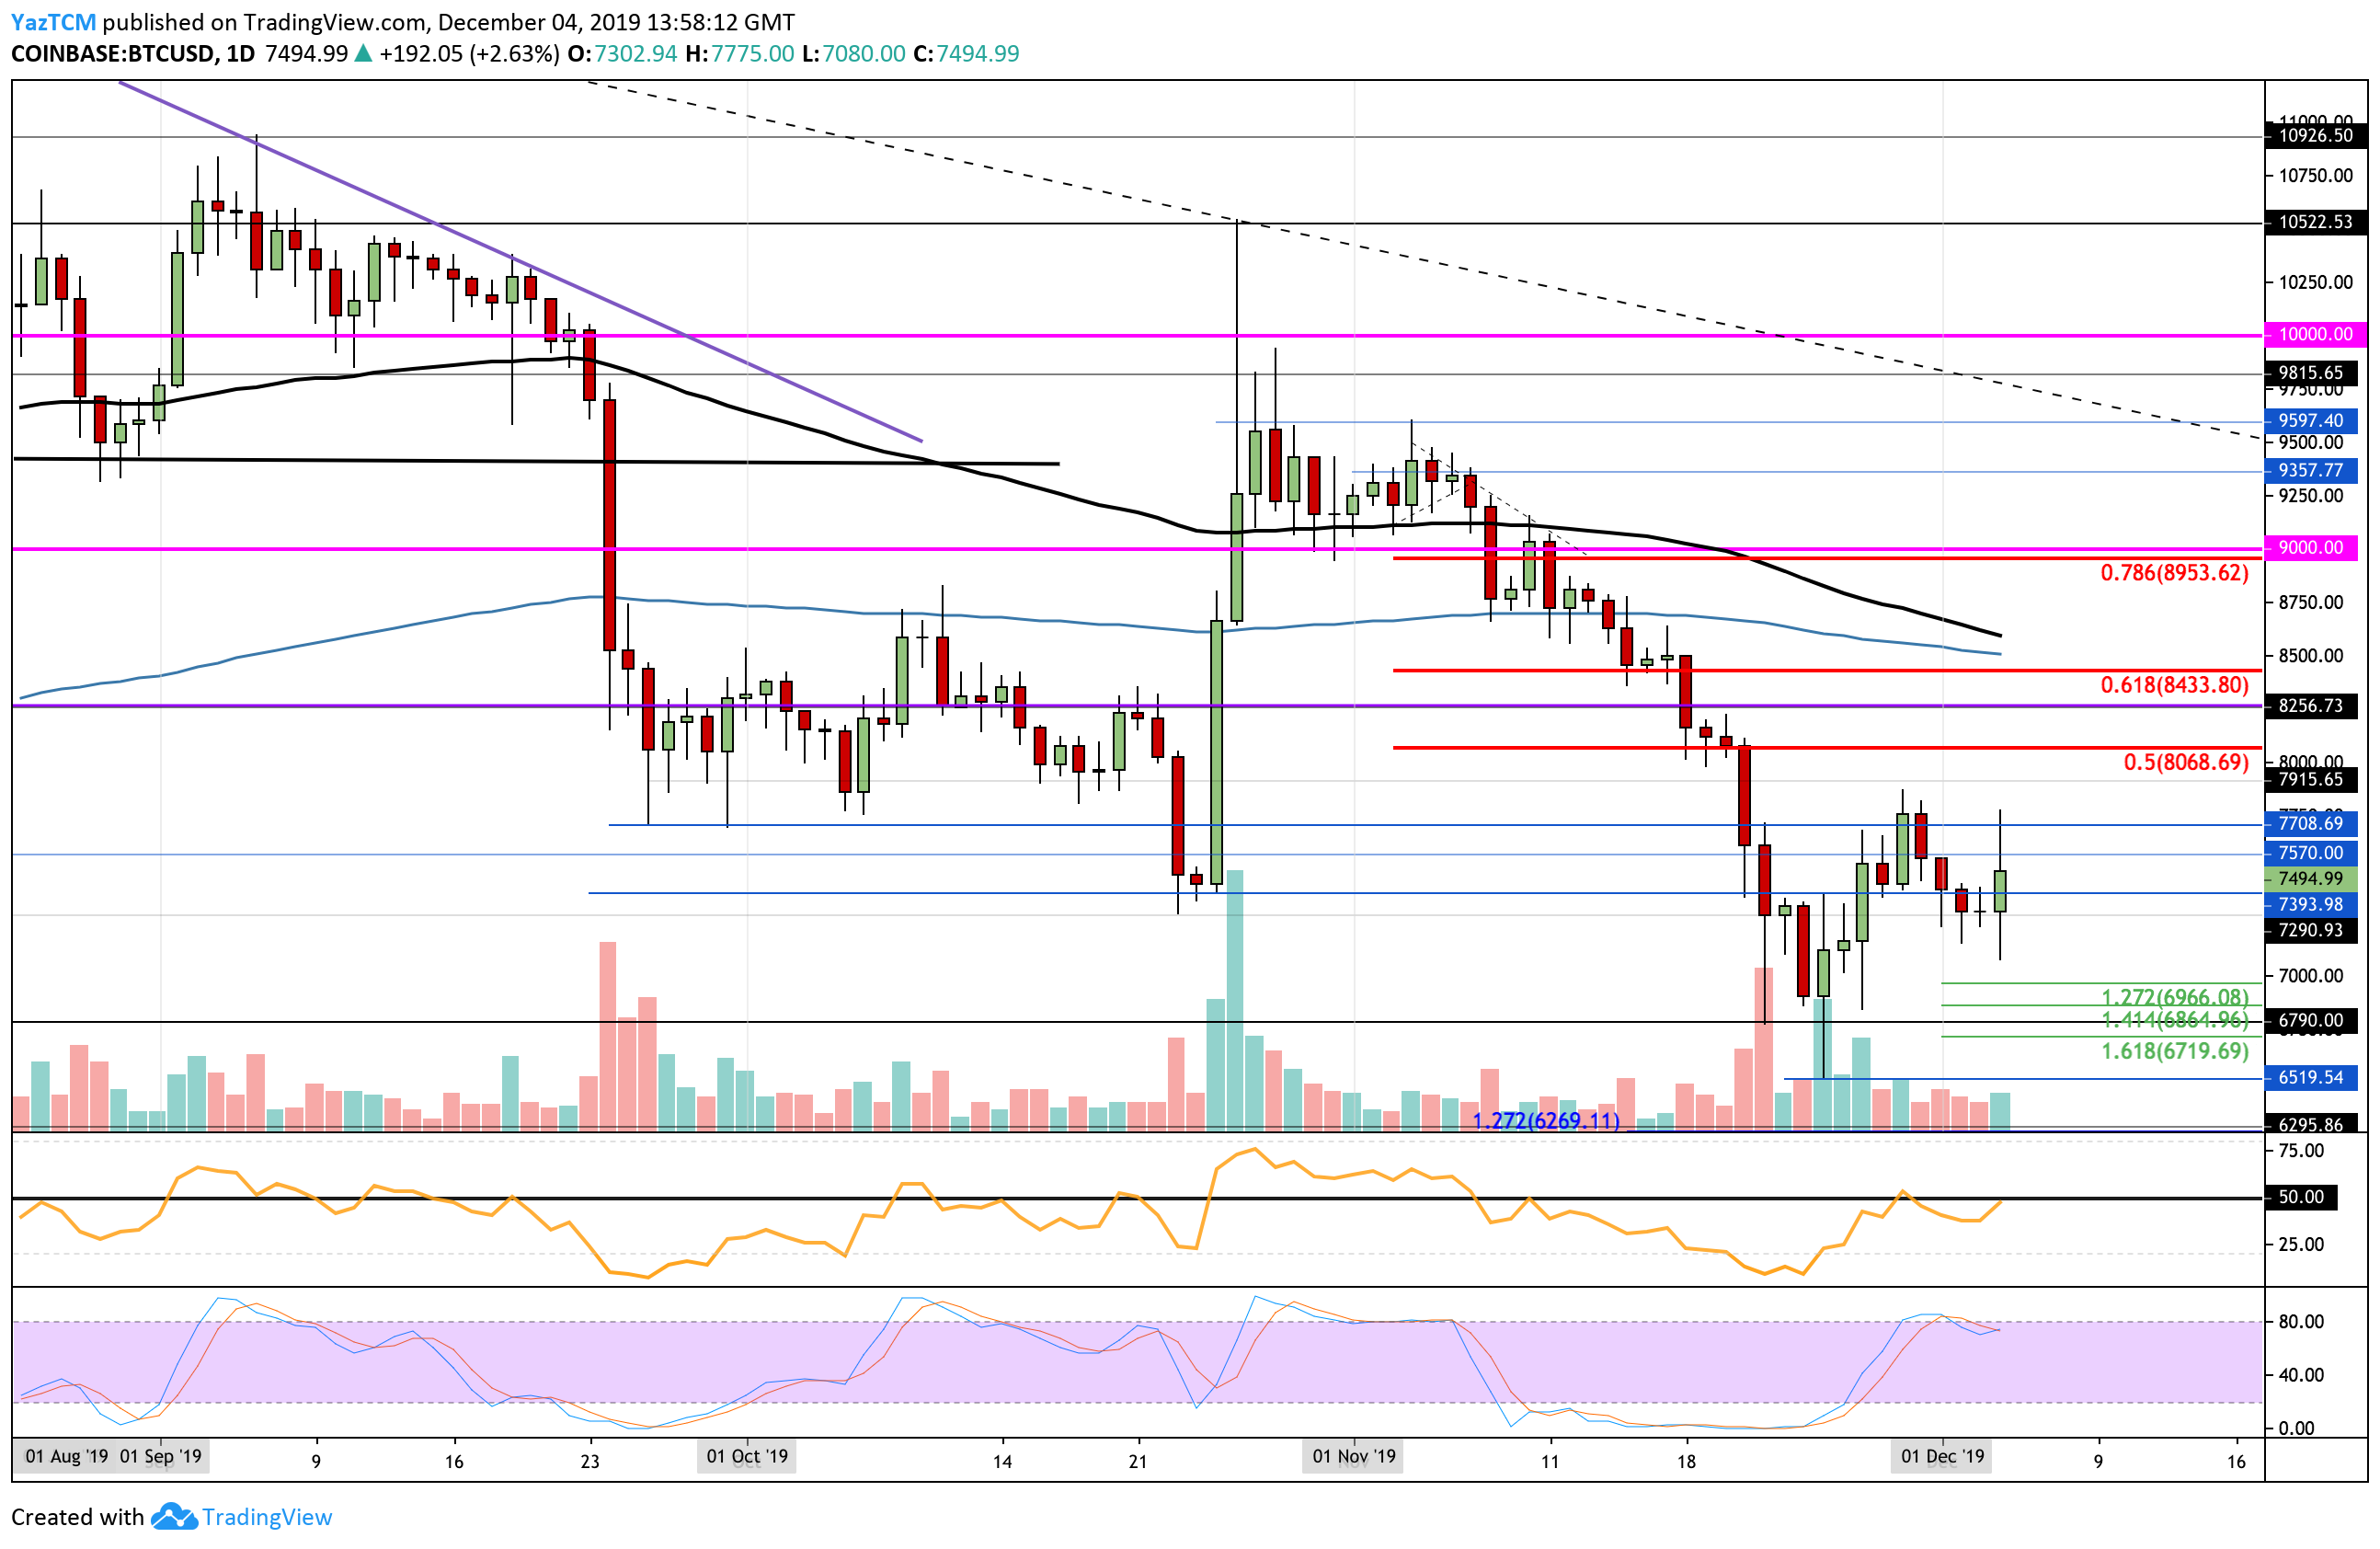
Bitcoin still remains bearish, we would need to see a strong push above $8,000 for this market to be considered as neutral. For this market to be considered as bullish, we would need to see price action rising above the November highs at around $9,600.
Toward the downside, initial support is located at $7,400. Beneath this, support lies at $7,290, $7,100, $7,000, and $6,966. If the sellers continue to drive the price lower, we can expect support at $6,790, $6,718, $6,519, and $6,270.
What if the bulls regroup?
Alternatively, if the bulls regroup, we can expect initial resistance to be located at $7,570 and $7,708. Above this, higher resistance lies at $7,915, $8,086, $8,265 and $8,433.
What are the technical indicators showing?
The RSI has reapproached the 50 level, which shows that the bulls are trying to gain control over the market momentum. For a bullish push higher, we would need to see the RSI rising above 50.


